Matrix-assisted laser desorption/ionization time-of-flight (MALDI-TOF) mass spectrometry applied to virus identification
- PMID: 25354905
- PMCID: PMC4213803
- DOI: 10.1038/srep06803
Matrix-assisted laser desorption/ionization time-of-flight (MALDI-TOF) mass spectrometry applied to virus identification
Abstract
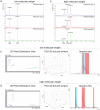
Virus detection and/or identification traditionally rely on methods based on cell culture, electron microscopy and antigen or nucleic acid detection. These techniques are good, but often expensive and/or time-consuming; furthermore, they not always lead to virus identification at the species and/or type level. In this study, Matrix-Assisted Laser Desorption/Ionization Time-of-Flight Mass Spectrometry (MALDI-TOF MS) was tested as an innovative tool to identify human polioviruses and to identify specific viral protein biomarkers in infected cells. The results revealed MALDI-TOF MS to be an effective and inexpensive tool for the identification of the three poliovirus serotypes. The method was firstly applied to Sabin reference strains, and then to isolates from different clinical samples, highlighting its value as a time-saving, sensitive and specific technique when compared to the gold standard neutralization assay and casting new light on its possible application to virus detection and/or identification.
Figures


Similar articles
-
Identification of different respiratory viruses, after a cell culture step, by matrix assisted laser desorption/ionization time of flight mass spectrometry (MALDI-TOF MS).Sci Rep. 2016 Oct 27;6:36082. doi: 10.1038/srep36082. Sci Rep. 2016. PMID: 27786297 Free PMC article.
-
MALDI-TOF mass spectrometry provides high accuracy in identification of Salmonella at species level but is limited to type or subtype Salmonella serovars.Eur J Mass Spectrom (Chichester). 2017 Apr;23(2):70-82. doi: 10.1177/1469066717699216. Epub 2017 Mar 24. Eur J Mass Spectrom (Chichester). 2017. PMID: 28657416
-
Rapid, Sensitive, and Specific Escherichia coli H Antigen Typing by Matrix-Assisted Laser Desorption Ionization-Time of Flight-Based Peptide Mass Fingerprinting.J Clin Microbiol. 2015 Aug;53(8):2480-5. doi: 10.1128/JCM.00593-15. Epub 2015 May 27. J Clin Microbiol. 2015. PMID: 26019207 Free PMC article.
-
Microbial fingerprinting using matrix-assisted laser desorption ionization time-of-flight mass spectrometry (MALDI-TOF MS) applications and challenges.Adv Appl Microbiol. 2010;71:149-84. doi: 10.1016/S0065-2164(10)71006-6. Epub 2010 Feb 20. Adv Appl Microbiol. 2010. PMID: 20378054 Review.
-
Matrix-assisted laser desorption/ionization time-of-flight mass spectrometry identification of Archaea: towards the universal identification of living organisms.APMIS. 2012 Feb;120(2):85-91. doi: 10.1111/j.1600-0463.2011.02833.x. Epub 2011 Nov 11. APMIS. 2012. PMID: 22229263 Review.
Cited by
-
MALDI-TOF MS: A Reliable Tool in the Real Life of the Clinical Microbiology Laboratory.Microorganisms. 2024 Feb 3;12(2):322. doi: 10.3390/microorganisms12020322. Microorganisms. 2024. PMID: 38399726 Free PMC article. Review.
-
A universal tool for marine metazoan species identification: towards best practices in proteomic fingerprinting.Sci Rep. 2024 Jan 13;14(1):1280. doi: 10.1038/s41598-024-51235-z. Sci Rep. 2024. PMID: 38218969 Free PMC article.
-
A review of the literature of Listeria monocytogenes in Africa highlights breast milk as an overlooked human source.Front Microbiol. 2023 Dec 20;14:1213953. doi: 10.3389/fmicb.2023.1213953. eCollection 2023. Front Microbiol. 2023. PMID: 38173673 Free PMC article. Review.
-
Mass spectrometry-based proteomics as an emerging tool in clinical laboratories.Clin Proteomics. 2023 Aug 26;20(1):32. doi: 10.1186/s12014-023-09424-x. Clin Proteomics. 2023. PMID: 37633929 Free PMC article. Review.
-
Monitoring of an Applied Beneficial Trichoderma Strain in Root-Associated Soil of Field-Grown Maize by MALDI-TOF MS.Microorganisms. 2023 Jun 25;11(7):1655. doi: 10.3390/microorganisms11071655. Microorganisms. 2023. PMID: 37512828 Free PMC article.
References
-
- Welker M. & Moore E. R. B. Application of whole-cell matrix-assisted laser desorption/ionization time-of-flight mass spectrometry in systematic microbiology. Syst. Appl. Microbiol. 34, 2–11 (2011). - PubMed
-
- Fenselau C. & Demirev P. A. Characterization of intact microorganisms by MALDI mass spectrometry. Mass Spectrom. Rev. 20, 157–171 (2001). - PubMed
-
- Lavigne J. P. et al. Mass spectrometry: a revolution in clinical microbiology? Clin. Chem. Lab. Med. 51, 257–270 (2013). - PubMed
-
- Wieser A., Schneider L., Jung J. & Schubert S. MALDI-TOF MS in microbiological diagnostics-identification of microorganisms and beyond (mini review). Appl. Microbiol. Biotechnol. 93, 965–974 (2012). - PubMed
-
- Susnea I. et al. Application of MALDI-TOF-Mass Spectrometry to Proteome Analysis Using Stain-Free Gel Electrophoresis. Top. Curr. Chem. 331, 37–54 (2013). - PubMed
Publication types
MeSH terms
Substances
LinkOut - more resources
Full Text Sources
Other Literature Sources

