. 2014 Nov 10;42(20):12707-21.
doi: 10.1093/nar/gku997. Epub 2014 Oct 21.

Trigger-helix folding pathway and SI3 mediate catalysis and hairpin-stabilized pausing by Escherichia coli RNA polymerase

Affiliations

Trigger-helix folding pathway and SI3 mediate catalysis and hairpin-stabilized pausing by Escherichia coli RNA polymerase

Tricia A Windgassen et al. Nucleic Acids Res. .

Abstract

The conformational dynamics of the polymorphous trigger loop (TL) in RNA polymerase (RNAP) underlie multiple steps in the nucleotide addition cycle and diverse regulatory mechanisms. These mechanisms include nascent RNA hairpin-stabilized pausing, which inhibits TL folding into the trigger helices (TH) required for rapid nucleotide addition. The nascent RNA pause hairpin forms in the RNA exit channel and promotes opening of the RNAP clamp domain, which in turn stabilizes a partially folded, paused TL conformation that disfavors TH formation. We report that inhibiting TH unfolding with a disulfide crosslink slowed multiround nucleotide addition only modestly but eliminated hairpin-stabilized pausing. Conversely, a substitution that disrupts the TH folding pathway and uncouples establishment of key TH-NTP contacts from complete TH formation and clamp movement allowed rapid catalysis and eliminated hairpin-stabilized pausing. We also report that the active-site distal arm of the TH aids TL folding, but that a 188-aa insertion in the Escherichia coli TL (sequence insertion 3; SI3) disfavors TH formation and stimulates pausing. The effect of SI3 depends on the jaw domain, but not on downstream duplex DNA. Our results support the view that both SI3 and the pause hairpin modulate TL folding in a constrained pathway of intermediate states.


Figures

Figure 1.
Figure 1.
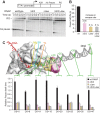
Structure and sequences of the TL/TH domain. (A) Model of the EcoRNAP EC in light gray space-fill showing the DNA (semi-transparent dark gray), RNA (red), active-site Mg2+ (yellow sphere) and the jaw (wheat) and SI3 (pink) domains. The dotted line depicts the approximate location of a slice through the EC that is rotated up ∼90° to give the main view in panel B. (B) Magnified view of TH and TL conformations in a model of the EcoRNAP EC based on the crystal structure of a TthRNAP EC bound to AMPCPP (PDB 2o5j (2) and a hydrid model of EcoRNAP (33)). The inset shows a space-filled rendering of EcoRNAP with some loops (BH, TL, lid, rudder, Zn-binding) shown as backbone worms for clarity. Nucleic acids, active-site Mg2+, jaw and SI3 domains are colored as in (A). The jaw (wheat) and SI3 (pink) domains are shown as worms, with only the connection of SI3 to the unfolded TL depicted for clarity (white segments are the connectors between the TL and SI3). The TH/TL is colored as follows: bases helices TH1b and TH2b (dark red), Hinges 1 and 2 (blue), TH1a (orange) and TH2a (magenta) and loop (cyan). The 188-aa SI3 is inserted between the loop and TH2a. Also shown are the incoming NTP (green), the BH (transparent cyan) and the Cys-pair reporters that detect the folded and unfolded conformation of the TH/TL (purple, F937–736 and U937–1139, respectively). Base helices TH1b and TH2b (dark red) do not change structure in the TL to TH transition. (C) Substructure of the TH and substitutions in EcoRNAP tested in this study. TH/TL is depicted in the same colors as in panel B also showing the positions of amino acids that make active site contacts to the NTP substrate to promote catalysis. The hinges (1 and 2; blue) contain Gly and Pro residues that destabilize the TH. Substitution locations depicted as spheres colored green (to stabilize) or gray (to destabilize) the TH, as highlighted in (D). (D) The sequences of the TL/TH in RNAPs from the three domains of life are shown colored as in panels B and C. Eco, Escherichia coli RNAP. Tth, Thermus thermophilus RNAP. Sce, Sacchaaromyces cerevisiae RNAPII. Hsa, Homo sapiens RNAPII. Pfu, Pyrococcus furiosis RNAP. Mja, Methanocaldococcus jannaschii RNAP. The locations of substitutions tested in this study are shown below the sequence alignment, with the two different SI3 deletions (SI3a and SI3b) shown in the top and bottom rows, respectively. The eukaryotic and archaeal jaw domains are not SBHM folds like the bacterial jaw domains.
Figure 2.
Figure 2.
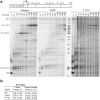
Effect of crosslinking TH in folded state and of 6Ala substitutions on multiround transcription. (A) ScaffoldGTP allows two rounds of GTP addition to reconstituted G13 ECs. The rates of GTP addition saturate below 10 mM GTP, allowing measurements of kcat for each GTP addition step at 1–10 mM GTP (17). Lowercase gray portion of NT strand denotes non-complementary bases to promote reconstitution. (B) Transcription reactions were performed using 5′-32P-labeled RNA on a rapid quench-flow device. Products were separated by polyacrylamide gel electrophoresis and quantified using a phosphorimager. A representative gel is shown for wild-type and F937–736 (ox) RNAPs. (C) Deconvolution of the rates of G14 and G15 addition for wild-type RNAP (left) and crosslinked F937–736 RNAP (right). Kinetic fitting to two sequential steps of GTP addition for one population (wild-type) or two populations (F937–736) of RNAP by a numerical integration algorithm (see Materials and Methods) allowed separation of the distinct species. The faster uncrosslinked (∼40%, u) and slower crosslinked (∼60%, x) fractions are clearly evident in the reaction progress curves (circles) and total RNAs predicted by the kinetic fitting algorithm (solid lines). The predicted levels of the individual uncrosslinked (u) and slower crosslinked (x) fractions for G14 are shown as semi-transparent areas. Percent crosslinked (β’X/total β’) was detected by SDS-PAGE (inset). (D) Calculated rates for G14 and G15 addition by wild-type, F937–736, 6Ala, DIPP and LTPP RNAPs at 1 mM GTP (wt) and 10 mM GTP for slowed RNAPs. (E) Exonuclease mapping of upstream edge of ECs. ECs were assembled on scaffold shown in (A) containing a 5′-32P-labeled template strand. Exonuclease digestion was performed on the complexes of wild-type or F937–736 RNAP to map the upstream edge of the transcription bubble. Data are presented as fraction of complexes that map to –15 relative to –14 and is derived from quantitation of the gel shown in Supplementary Figure S2. Data are means ± SD of experimental triplicates.
Figure 3.
Figure 3.
6Ala TH stabilization detected by CPR mapping of TL/TH conformation. (A) Schematic of F937–736 (orange) and U937–1139 (green) CPRs detecting the folded TH and unfolded TL conformations. (B) F937–736 and 6Ala F937–736 fraction crosslinked (orange) and U937–1139 and 6Ala U937–1139 (green; contains 5 of the 6Ala residues in the 6Ala RNAP, sixth residue is Cys in this variant). Bar graphs show the fraction crosslinked at saturating levels (EH –0.136 V) for free core RNAP or EC 3′deoxyG13 (ScaffoldGTP; Figure 2A; EC G13 containing 3′-dGMP) in the presence and absence of 10 mM GTP. Data are means ± SD of experimental triplicates.
Figure 4.
Figure 4.
Kinetics of TH2a mutants for UTP addition. (A) ScaffoldUTP allows single-round NTP incorporation measurement upon EC RNAP reconstitution at G14, incorporation of 32P-CTP and ATP to A16, and extension of this EC with addition of UTP at time zero. (B) Rate of single round UTP incorporation for wild-type (filled circles, left y-axis) and LTPP RNAPs (open circles, right y-axis). (C) Comparison of kcat between wt and TL mutant RNAPs, derived from kinetic parameters derived from experiments including ones presented in (B). Data are means ± SD of experimental triplicates.
Figure 5.
Figure 5.
Blocking TH1a unfolding prevents hairpin-stabilization of pausing. (A) ScaffoldPEC allows his pause escape measurement by reconstituting ECs upstream of the pause, adding 32P-CTP to advance to C28 (pause-1), and then adding UTP (100 μM) and GTP (10 μM) at time zero to elongate through the pause site. (B) Kinetics of pause behavior for F937–736 RNAP under reduced, oxidized and re-reduced (oxidized and then reduced, rred) conditions, determined from kinetic fits of data included in C, D and E. (C) F937–736 RNAP (reduced) transcription products were resolved through denaturing PAGE. Fraction of C28, U29 and G30/G31 were fit and rates determined by numerical integration algorithm using the reaction scheme in (A) (Materials and Methods). The reduced RNAP state was confirmed through SDS-PAGE (inset). (D) As in (C), but using F937–736 RNAP under oxidized conditions. Transcription products show increased bypass fraction with crosslinking (65% confirmed through SDS-PAGE, inset). (E) As in (C), but using F937–736 RNAP that has been re-reduced (rred). The treatment reverses the pausing effects of crosslinking F937–736. Data are means ± SD of experimental triplicates.
Figure 6.
Figure 6.
Uncoupling TH1a formation from TH1b promotes catalysis and prevents hairpin-stabilization of pausing. (A) Processivity and pausing of wild-type, PGPP and F773V RNAPs analyzed by promoter-initiated transcription on a long template containing the ops pause, his pause and his terminator (pIA349, Supplementary Table S1), reactions separated by 8% PAGE. Reactions proceed from halted complexes (HC) after addition of all four NTP at time 0. RO, run-off product. (B) The pause fraction and escape rate on the his pause for wild-type, PGPP and F773V RNAPs were quantified on reconstituted scaffoldPEC as in Figure 5 but starting reactions at U29 (pause) at time 0 and measuring pause escape. Data are means ± SD of experimental triplicates.
Figure 7.
Figure 7.
SI3 effects on elongation, pausing, and CPR mapping of TL/TH conformation. (A) Single-round NTP addition rates with ScaffoldUTP (Fgure 4) for wild-type and ΔSI3 RNAPs under predicted UTP saturation levels (10 mM). ΔSI3a corresponds to Δ1043–1130 and ΔSI3b corresponds to Δ1045–1132. (B) Comparison of his pause kinetics on scaffoldPEC (as in Figure 5) for wild-type, ΔSI3a and ΔSI3b RNAPs. (C) Comparison of UTP addition kinetics (as in Figure 4) for RNAP variants ± ΔSI3. (D) F937–736 ± ΔSI3 and 6Ala F937–736 ± ΔSI3 fraction crosslinked as a function of redox potential (2.5 mM CSSC, varying DTT) in free core RNAP, EC (ScaffoldGTP) and PEC (ScaffoldPEC at pause). Data are means ± SD of experimental triplicates.
Figure 8.
Figure 8.
SI3 and the jaw do not modulate the active site through their putative downstream DNA contacts. (A) His pause escape on a promoter-driven his pause template (29) for wild-type, ΔSI3, Δjaw, and ΔSI3Δjaw RNAPs. Preformed [α-32P]-CTP-labeled A29 complexes were incubated with 20 μM GTP, 150 μM ATP, CTP and UTP, together with 50 μg heparin/ml. Position of pause and run-off (RO) transcripts are indicated. Samples were taken at the times indicated (ch, chase). (B) Bar graph showing the average pause half-life values of wild-type, ΔSI3, Δjaw, and ΔSI3Δjaw RNAPs at his pause site derived from the experiment shown in (A) and two additional experiments shown as means ± SD. Numbers above the bars indicate the fold-increase in pause escape rate. (C) Pausing for wild-type, ΔSI3, Δjaw, and ΔSI3Δjaw RNAPs on templates with different amounts of downstream sequence. Top: schematic of paused elongation complex illustrating the progressive downstream-DNA truncations. The RNAP (gray spacefill), DNA (gray) and RNA (red) are shown. Positions of duplex DNA truncations are indicated on the schematic drawing by green lines and numbers indicating the number of base pairs downstream of the pause site, where the pause site with RNAP in pre-translocated register is denoted as the +1 position. Bottom: normalized pause half-lives of wild-type, ΔSI3, Δjaw, and ΔSI3Δjaw RNAPs on truncation templates. The half-life of wild-type RNAP on DS+47 (47 bp of downstream DNA duplex) was normalized to 1 and all other pause half-life values were normalized accordingly. Data are means ± SD of experimental triplicates.
Figure 9.
Figure 9.
Folding of the TL into the TH is coupled with movements of other modules of RNAP. (Left) The BH, anchor and cap modules link clamp position with folding of the TL (TH1a, TH2a and the hinges) to form the TH. The TH1a contacts to the NTP allow correct positioning for catalysis in the active EC. (Center) The PGPP mutant uncouples TH1a from the clamp position. (Right) In the hairpin-stabilized PEC, the paused TL conformation is stabilized by clamp opening resulting from formation of the pause RNA hairpin and also involves rearrangements of the BH and the BH/TL cap. These BH and cap rearrangements inhibit the cap's interaction with the loop of the TH.
Scheme 1.
Scheme 1.
Scheme 2.
Scheme 2.
Scheme 3.
Scheme 3.

Similar articles

Cited by

References

    1. Seibold S.A., Singh B.N., Zhang C., Kireeva M., Domecq C., Bouchard A., Nazione A.M., Feig M., Cukier R.I., Coulombe B., et al. Conformational coupling, bridge helix dynamics and active site dehydration in catalysis by RNA polymerase. Biochim. Biophys. Acta. 2010;1799:575–587. - PMC - PubMed
    1. Vassylyev D., Vassylyeva M., Zhang J., Palangat M., Artsimovitch I., Landick R. Structural basis for substrate loading in bacterial RNA polymerase. Nature. 2007;448:163–168. - PubMed
    1. Wang D., Bushnell D., Westover K., Kaplan C., Kornberg R. Structural basis of transcription: role of the trigger loop in substrate specificity and catalysis. Cell. 2006;127:941–954. - PMC - PubMed
    1. Zhang J., Palangat M., Landick R. Role of the RNA polymerase trigger loop in catalysis and pausing. Nat. Struct. Mol. Biol. 2010;17:99–104. - PMC - PubMed
    1. Tan L., Wiesler S., Trzaska D., Carney H.C., Weinzierl R.O. Bridge helix and trigger loop perturbations generate superactive RNA polymerases. J. Biol. 2008;7:40.1–40.15. - PMC - PubMed

Publication types