. 2014 Oct 21;9(10):e110498.
doi: 10.1371/journal.pone.0110498. eCollection 2014.

Polycomb Repressive Complex 2 regulates lineage fidelity during embryonic stem cell differentiation

Affiliations

Polycomb Repressive Complex 2 regulates lineage fidelity during embryonic stem cell differentiation

Seraphim R Thornton et al. PLoS One. .

Abstract

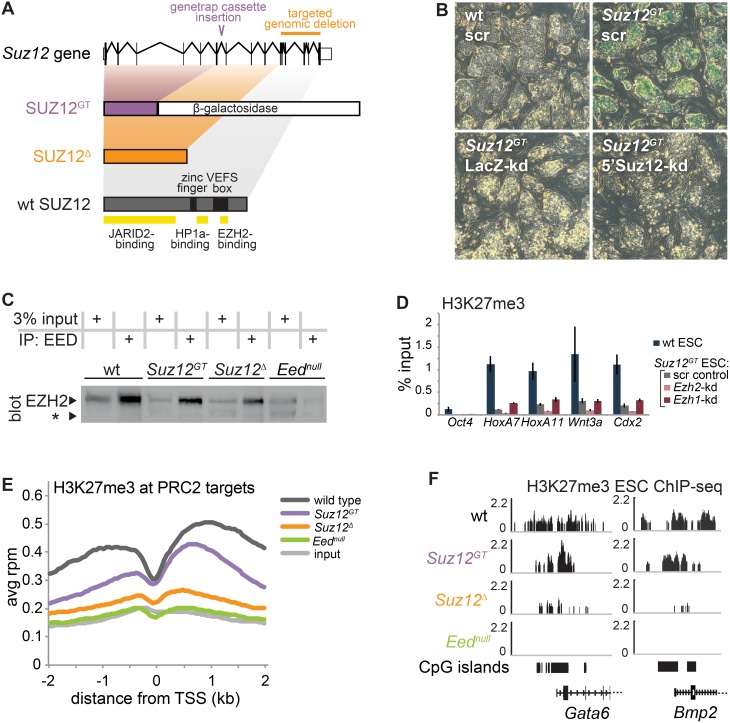
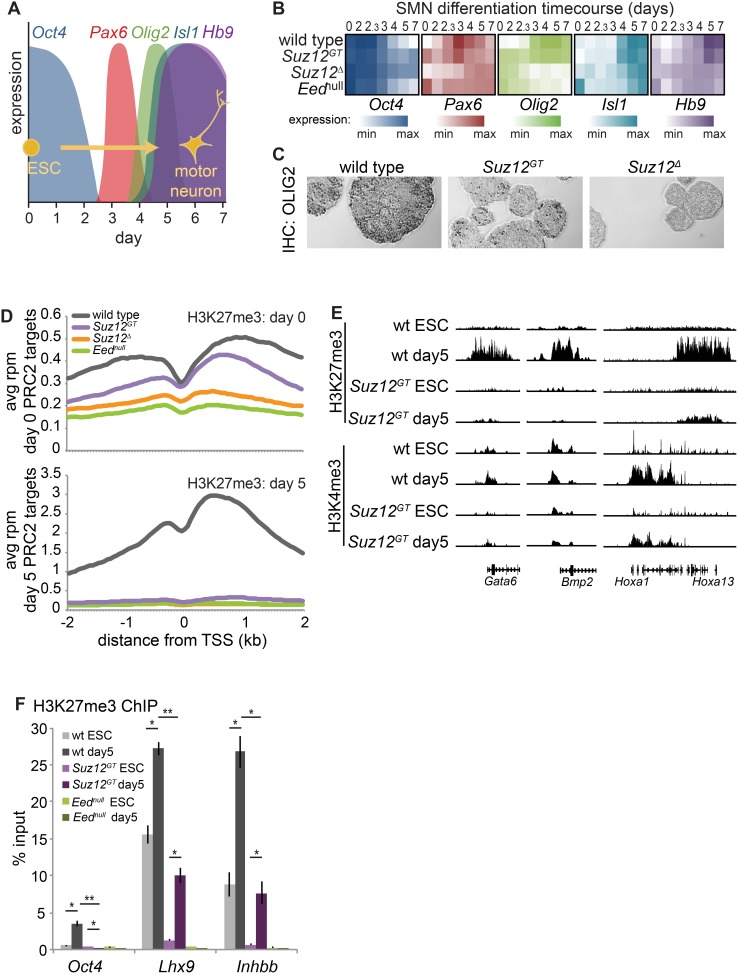
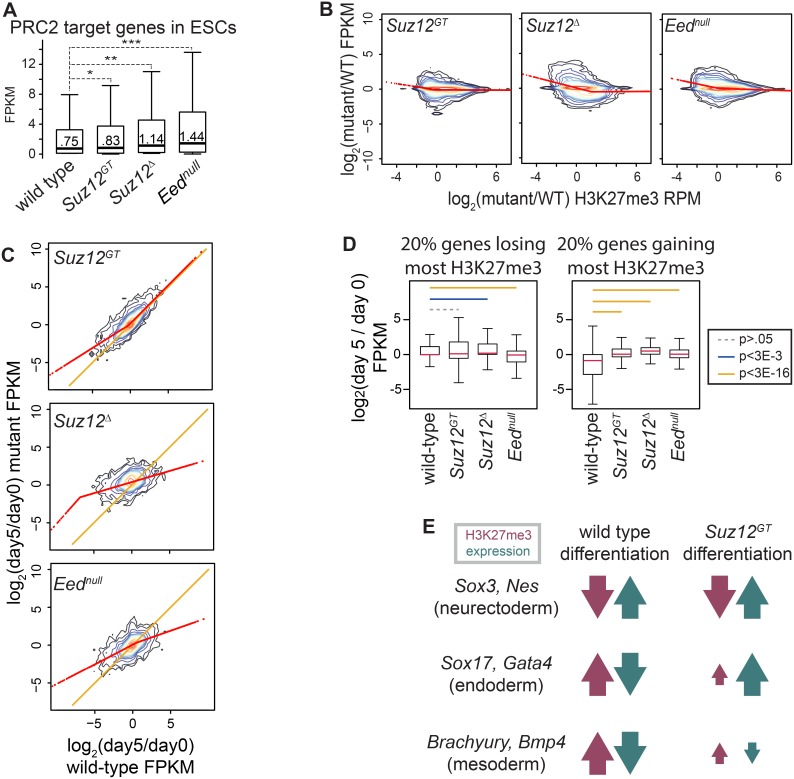
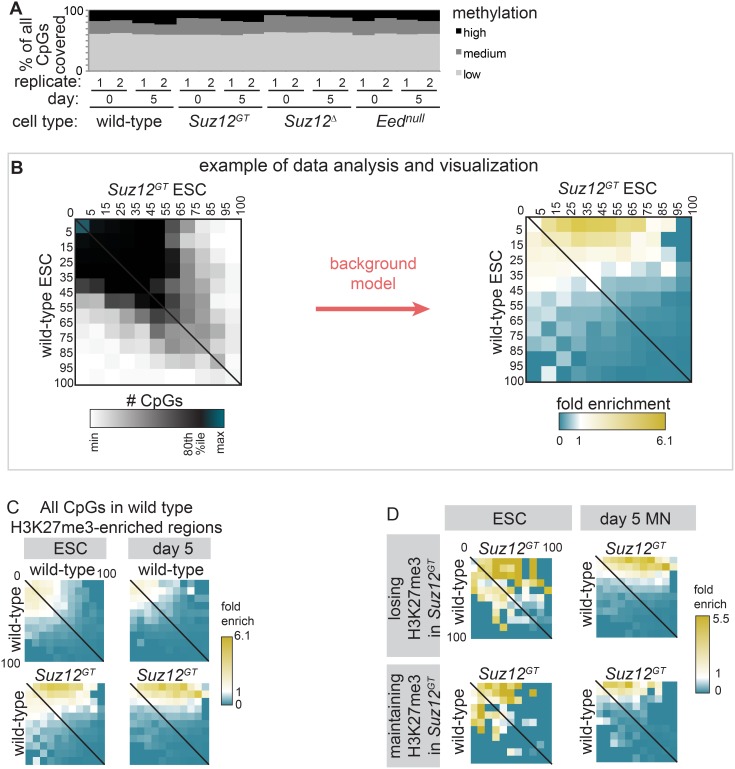
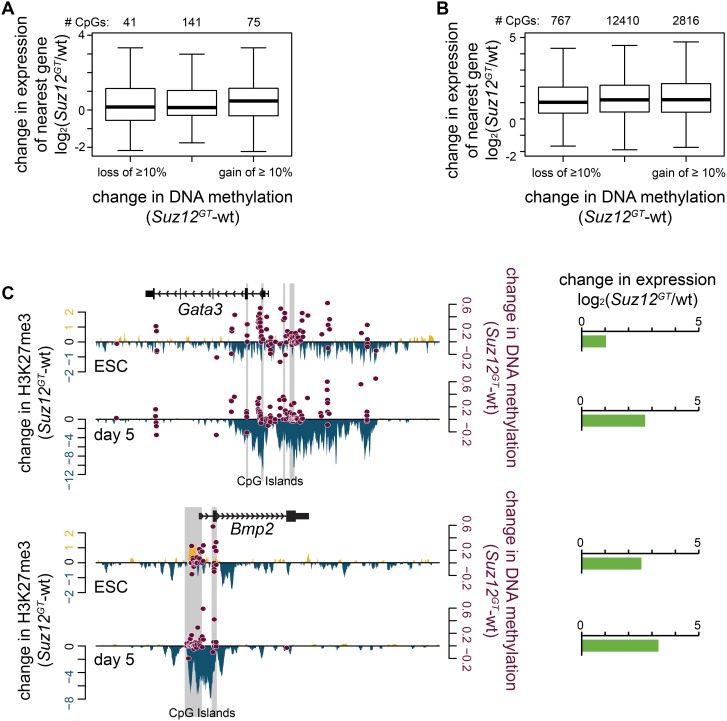
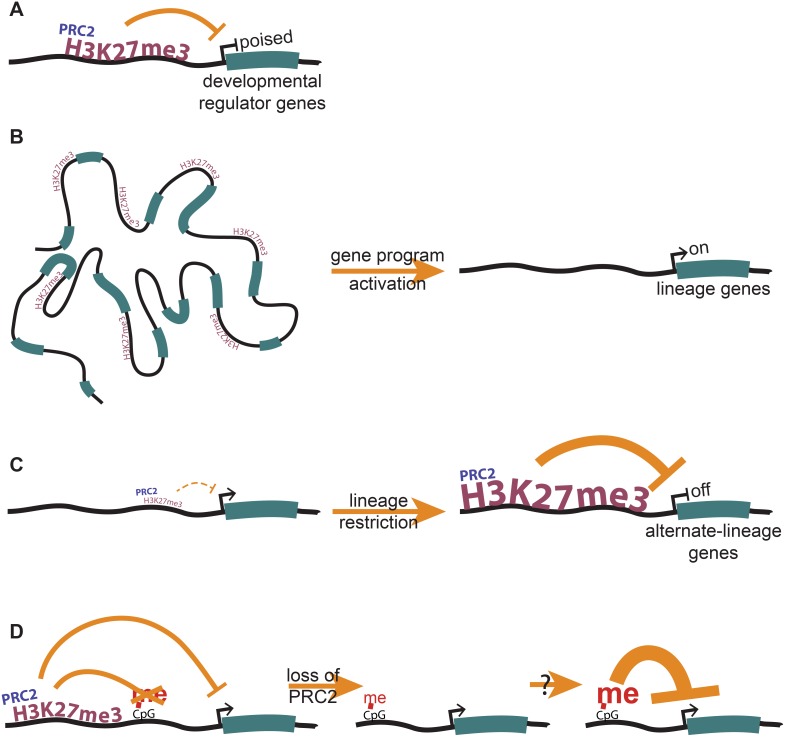
Polycomb Repressive Complex 2 (PRC2) catalyzes histone H3 lysine 27 tri-methylation (H3K27me3), an epigenetic modification associated with gene repression. H3K27me3 is enriched at the promoters of a large cohort of developmental genes in embryonic stem cells (ESCs). Loss of H3K27me3 leads to a failure of ESCs to properly differentiate, making it difficult to determine the precise roles of PRC2 during lineage commitment. Moreover, while studies suggest that PRC2 prevents DNA methylation, how these two epigenetic regulators coordinate to regulate lineage programs is poorly understood. Using several PRC2 mutant ESC lines that maintain varying levels of H3K27me3, we found that partial maintenance of H3K27me3 allowed for proper temporal activation of lineage genes during directed differentiation of ESCs to spinal motor neurons (SMNs). In contrast, genes that function to specify other lineages failed to be repressed in these cells, suggesting that PRC2 is also necessary for lineage fidelity. We also found that loss of H3K27me3 leads to a modest gain in DNA methylation at PRC2 target regions in both ESCs and in SMNs. Our study demonstrates a critical role for PRC2 in safeguarding lineage decisions and in protecting genes against inappropriate DNA methylation.


Conflict of interest statement

Competing Interests: The authors have declared that no competing interests exist.

Figures

Figure 1
Figure 1. Comparison of PRC2 mutant ESC lines.
(A) At top, a diagram of the structure of the wild-type (wt) Suz12 gene. Below, the proteins encoded by the two mutant alleles used here (SUZ12GT and SUZ12Δ) and the wt allele are shown to scale, and domains of interest are noted on wt SUZ12. (B) X-gal staining was performed on wt ESCs (upper left) and Suz12GT ESCs (upper right) expressing either a scrambled control hairpin, a hairpin targeted to LacZ (encoding β-galactosidase) (lower left), or a hairpin targeted to the 5′ end of Suz12 (lower right). (C) Immunoprecipitation of EED was performed in wt, Suz12GT, Suz12Δ, and Eednull ESCs. The samples, including 3% input, were subjected to SDS-PAGE. EZH2 immunoblot was performed as indicated by the labeled band (left). EZH2 degradation product is marked by an asterisk (*). (D) ChIP-qPCR for H3K27me3 was performed on wt and Suz12GT ESCs expressing hairpins: scr (scrambled control), Ezh2-kd (targeted to Ezh2), and Ezh1-kd (targeted to Ezh1). All genes tested except Oct4 are PRC2 target genes. Error bars show standard deviation of three technical replicates. In (E) and (F), ChIP-seq for H3K27me3 was performed on wt, Suz12GT, Suz12Δ, and Eednull ESCs. ChIP-seq datasets are normalized to the total mapped reads. (E) A metagene analysis of H3K27me3 ChIP-seq enrichment is shown across the average of all PRC2 target genes +/− 2 kb relative to the TSS for wt, Suz12GT, Suz12Δ, and Eednull ESCs, as well as input. (F) H3K27me3 ChIP-seq tracks in ESCs. Representative examples of PRC2 target promoters (Gata6 and Bmp2) showing H3K27me3 levels in Suz12GT, Suz12Δ, and Eednull ESCs.
Figure 2
Figure 2. H3K27me3 levels show differences across SMN differentiation in Suz12GT cells compared to wt cells.
(A) Cartoon showing changes in marker expression across the spinal motor neuron (SMN) differentiation time course. (B) Heatmap of qRT-PCR analysis of genes from (A). White: minimum expression; saturated color: maximum expression level observed for that gene. Expression for each of the five genes is shown, log2 transformed, for wild-type (wt) (top), Suz12GT (2nd), Suz12Δ (3rd), and Eednull (bottom) cells. The time course progresses from left to right for 7 days. (C) IHC for OLIG2 on paraffin-embedded sectioned day 5 SMNs. OLIG2 expression is shown as darkly stained cells. (D) ChIP-seq enrichment for H3K27me3 is shown for wt, Suz12GT, Suz12Δ, and Eednull ESCs and corresponding day 5 differentiated cells. ChIP-seq datasets are represented as metagene plots showing average reads per million within 2 kb of all TSSs for wt, Suz12GT, Suz12Δ, and Eednull cells. Day 0 (ESC) is at top, while day 5 SMN is shown at bottom. (E) H3K27me3 and H3K4me3 ChIP-seq tracks for Gata6 promoter (left); Bmp2 promoter (middle); and the HoxA cluster (right) show that H3K27me3 levels change (increase, decrease, or stay the same, depending upon locus) in Suz12GT cells upon differentiation. H3K4me3 levels change similarly in Suz12GT and wild-type cells over differentiation, but at lower levels in Suz12GT. (F) ChIP-qPCR data confirm that Suz12GT cells are capable of gaining significant H3K27me3 at Lhx9 and Inhbb, the two genes that gain the most H3K27me3 over differentiation in wt cells according to the ChIP-Seq data, whereas Eednull cells show no gain in H3K27me3 at these genes. Error bars represent standard deviation of three technical replicates. P-values were calculated with a Student’s two-sided t-test. *: p<5E-10; **: p<5E-15.
Figure 3
Figure 3. Proper H3K27me3 levels are necessary for coordinating developmental gene expression programs.
(A) RNA-seq of wild-type (wt), Suz12GT, Suz12Δ, and Eednull ESCs. Distributions of FPKMs of PRC2 target genes are shown as box and whisker plots that extend from the 25th to 75th percentile; whiskers represent 1.5x the length of the box. P-values were calculated with Student’s two-sided t-test. *: p<5E-2; **: p<5E-5; ***: p<5E-7. (B) RNA-seq and H3K27me3 ChIP-seq are shown for Suz12GT (left panel), Suz12Δ (middle panel), and Eednull (right panel) ESCs with respect to wt. Kernel densities of the data are represented along 14 levels. A segmented regression method was used to calculate localized best-fit and is plotted in red. (C) RNA-seq of wt, Suz12GT, Suz12Δ, and Eednull ESCs and day 5 SMNs. y-axis shows log2 of the ratio of FPKM in differentiated: ESC in mutant lines as indicated; x-axis represents this ratio in wt cells. Kernel densities of the data are represented along 14 levels. Segmented regression on the data is plotted in red and the y = x line in orange. (D) Relationship between change in H3K27me3 and expression over differentiation is shown as box plots. All genes were binned by change in H3K27me3 levels over differentiation in each respective cell type (log2 of H3K27me3 (day 5/day 0)). y-axis shows distribution of change in expression (log2 of FPKM (day 5/day 0)). Left panel: bottom quintile in each cell type. Right panel: top quintile in each cell type. P-values were calculated using a Student’s t-test and are represented by colored lines between bins. (E) Change in H3K27me3 and expression over differentiation for representative genes. Gain or loss in H3K27me3 or expression is represented by upward or downward arrow, respectively, whereas magnitude is represented by size of arrow.
Figure 4
Figure 4. PRC2 is antagonistic to DNA methylation in cis.
Through RRBS, percent methylation at each CpG with ≥10-fold coverage was calculated in wild-type (wt), Suz12GT, Suz12Δ, and Eednull ESCs and day 5 differentiated cells. (A) Distribution of methylation at all CpGs is shown. Low: ≤15% methylated; high: ≥80%. (B) This panel is an explanatory example of the data analysis and visualizations used in Figures 4C–D, using the lower-left heatmap of 4C as an example. (left) CpGs were binned according to % methylation in wt (y-axis) and Suz12GT (x-axis) ESCs. Thus, the matrix displays the number of CpGs in each 2-D bin. The data is largely along the x = y line (CpGs with the same % methylation in Suz12GT as wild-type), shifting towards the top right (more methylation in Suz12GT). (right) Fold enrichment over the overall distribution of the data was determined for each bin using a replicate-based background model (see Methods). In this example, high statistical enrichment over background in Suz12GT cells (yellow) is visible for CpGs with little methylation in wt cells (C) CpGs in wt H3K27me3-enriched regions are used to analyze changes in DNA methylation in ESCs (left panel) and day 5 SMN (right panel). The enrichment in the lower heatmaps shows CpGs with low methylation in wt (y-axis) gaining methylation in Suz12GT (x-axis). (D) (Top) H3K27me3-enriched regions in wt ESCs that lose enrichment in Suz12GT. (Bottom) Regions maintaining H3K27me3 enrichment in Suz12GT ESCs. Regions losing H3K27me3 in Suz12GT cells gain overall more DNA methylation than those maintaining significant H3K27me3.
Figure 5
Figure 5. Increased DNA methylation upon loss of PRC2 does not lead to target gene repression.
(A) Regions with significantly enriched H3K27me3 in wild-type (wt) ESCs were considered. All CpGs in these regions with 10x coverage via RRBS in both wt and Suz12GT ESCs, and ≥.1 FPKM in at least one of these cell types, were used in the analysis. Of these 257 CpGs, 41 lose ≥10% DNA methylation, 75 gain ≥10% DNA methylation, and 141 do not change. The distribution of change in expression in Suz12GT ESCs with respect to wt ESCs of the genes associated with these CpGs is plotted on the y-axis. No association between change in DNA methylation and gene expression is observed. (B) Same as in (A) except in day 5 SMNs. Of these 15993 CpGs, 767 lose ≥10% DNA methylation, 2816 gain ≥10% DNA methylation, and 12410 do not change. The distribution of change in expression in Suz12GT cells with respect to wt cells of the genes associated with these CpGs is plotted on the y-axis. No association between change in DNA methylation and gene expression is observed. (C) Two example genes, Gata3 and Bmp2, are shown here. Change in H3K27me3 signal between wt and Suz12GT cells is plotted on the left y-axis; gain in Suz12GT is shown in yellow, and loss is shown in blue. Change in DNA methylation for each CpG with 10x coverage in both cell types is plotted in maroon on the right y-axis. Change in gene expression (log2 of the ratio of the FPKMs (Suz12GT/wt)) is shown in horizontal bar graphs to the right of the panel.
Figure 6
Figure 6. PRC2 plays roles in gene regulation both in pluripotency and during lineage commitment.
(A) In ESCs, PRC2 localizes largely to developmental regulator genes, and maintains them in their repressed, and yet poised, state. (B) Proper H3K27me3 levels are necessary to activate developmental gene programs during differentiation. (C) A gain in H3K27me3 during differentiation represses alternate-lineage genes, allowing for efficient lineage restriction. (D) PRC2 antagonizes DNA methylation in cis, and may play a role in preventing the premature permanent repression of developmental genes.

Similar articles

Cited by

References

    1. Surface LE, Thornton SR, Boyer LA (2010) Polycomb group proteins set the stage for early lineage commitment. Cell Stem Cell 7: 288–298 10.1016/j.stem.2010.08.004 - DOI - PubMed
    1. Simon JA, Kingston RE (2009) Mechanisms of polycomb gene silencing: knowns and unknowns. Nat Rev Mol Cell Biol 10: 697–708 10.1038/nrm2763 - DOI - PubMed
    1. Di Croce L, Helin K (2013) Transcriptional regulation by Polycomb group proteins. Nat Struct Mol Biol 20: 1147–1155 10.1038/nsmb.2669 - DOI - PubMed
    1. Pasini D, Bracken AP, Jensen MR, Lazzerini Denchi E, Helin K (2004) Suz12 is essential for mouse development and for EZH2 histone methyltransferase activity. EMBO J 23: 4061–4071 10.1038/sj.emboj.7600402 - DOI - PMC - PubMed
    1. Faust C, Schumacher A, Holdener B, Magnuson T (1995) The eed mutation disrupts anterior mesoderm production in mice. Development 121: 273–285. - PubMed

Publication types

Associated data