Review
. 2014 Oct 2:6:266.
doi: 10.3389/fnagi.2014.00266. eCollection 2014.

Diffusion tensor imaging in Alzheimer's disease: insights into the limbic-diencephalic network and methodological considerations

Affiliations
Review

Diffusion tensor imaging in Alzheimer's disease: insights into the limbic-diencephalic network and methodological considerations

Julio Acosta-Cabronero et al. Front Aging Neurosci. .

Abstract

Glucose hypometabolism and gray matter atrophy are well known consequences of Alzheimer's disease (AD). Studies using these measures have shown that the earliest clinical stages, in which memory impairment is a relatively isolated feature, are associated with degeneration in an apparently remote group of areas-mesial temporal lobe (MTL), diencephalic structures such as anterior thalamus and mammillary bodies, and posterior cingulate. These sites are thought to be strongly anatomically inter-connected via a limbic-diencephalic network. Diffusion tensor imaging or DTI-an imaging technique capable of probing white matter tissue microstructure-has recently confirmed degeneration of the white matter connections of the limbic-diencephalic network in AD by way of an unbiased analysis strategy known as tract-based spatial statistics (TBSS). The present review contextualizes the relevance of these findings, in which the fornix is likely to play a fundamental role in linking MTL and diencephalon. An interesting by-product of this work has been in showing that alterations in diffusion behavior are complex in AD-while early studies tended to focus on fractional anisotropy, recent work has highlighted that this measure is not the most sensitive to early changes. Finally, this review will discuss in detail several technical aspects of DTI both in terms of image acquisition and TBSS analysis as both of these factors have important implications to ensure reliable observations are made that inform understanding of neurodegenerative diseases.

Keywords: Alzheimer's disease biomarkers; Alzheimer's disease neurobiology; DTI criteria; axonal loss; circuit of Papez; long association tracts; neurodegenerative diseases; splenium.


Figures

Figure 1
Figure 1
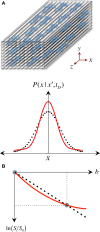
Measurement of the “self-diffusion” coefficient with magnetic resonance. (A) Self-diffusion is a special case of diffusion that describes the relentless motion of microscopic particles in a substance. Such motion is random—it can be described by a “Gaussian” distribution whose width determines how far particles travel on average after some time; the important thing to remember is that only time, the “diffusion time,” and the “self-diffusion coefficient,” D, modulate this width. (B) Illustration of a magnetic resonance pulse sequence that is sensitive to self-diffusion: (i) an “excitation pulse” gives some energy to water protons; (ii) then the first “gradient” encodes where they are; (iii) and some (diffusion) time later, a second gradient decodes their position by giving them a “signal penalty” according to how far they have moved away from their original position; (iv) as a result of this penalty, protons that have moved furthest, return the least signal. The overall signal attenuation is a function of D and the gradient characteristics—i.e., intensity (G), duration (tG) and diffusion time (tD)—usually conglomerated into a single term known as the “b-value.” (C) Visual representation of the linear fit required to quantify D using two signals: a diffusion weighted measurement (i.e., with a non-zero b-value), S, that must be normalized by a measurement without diffusion weighting, S0 (also often called b0); D can be inferred as the “negative” of the slope.
Figure 2
Figure 2
The “diffusion tensor.” (A) Six combinations of gradients applied with different intensities along three orthogonal orientations (x. y, and z), and a measurement without diffusion weighting, are the minimum requirements to probe diffusion in a 3D space; each non-collinear combination is called a “diffusion direction.” (B) A larger number of diffusion directions, Nd, can estimate the directional dependence of microstructural restrictions to water diffusion with greater precision. (C) Basser et al. (1994b) proposed the formulation of a diffusion tensor (represented by an ellipsoid) to capture diffusion behaviors in 3D with a finite Nd. (D) The tensor can be rotated to match the principal direction of diffusion, i.e., in white matter, the first eigenvector (ε1) matches the predominant fiber tract orientation; thus, the largest eigenvalue (λ1, known as “axial diffusivity”) quantifies water mobility along this orientation. Analogously, ε2 and ε3 define the plane perpendicular to the axonal arrangement so that λ2 and λ3 can be averaged as a “radial diffusivity” (RD). In addition, all three eigenvalues can be averaged to estimate the “mean square displacement” of water molecules—that is, the “mean diffusivity” (MD).
Figure 3
Figure 3
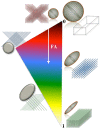
Differential tensor behaviors in white matter. Cell membranes are thought to be the main restricting boundary to water mobility in white matter. As such, the ratio of axial to radial diffusivities, commonly described by a metric known as “fractional anisotropy” (FA), can reflect the coherence (sometimes thus the integrity) of packed axons in white matter. FA approaches one in well-organized tracts, where the diffusion ellipsoid is elongated along the principal tract orientation; and tends to zero, in less coherent environments—i.e., in heterogeneous areas of many crossing fibers, and in gray matter or cerebrospinal fluid—, where the ellipsoid resembles a sphere. In the full complexity of white matter microstructure, however, the ellipsoid can take a wider range of geometries from that of a rugby ball to that of surfboard or a dish—with the degree of sphericity and planarity dictated primarily—but not only—by axon packing density, degree of myelination and/or the geometrical arrangement of crossing, kissing and/or splaying fiber populations.
Figure 4
Figure 4
The approximate nature of the “single tensor” model. (A) “Restricted” diffusion processes such as those in white matter result in displacement probabilities that are no longer accurately described by a Gaussian “bell.” (B) Therefore, the assumption that the signal attenuation must have a linear relationship in a logarithmic scale with the b-value is no longer valid, resulting in tensor diffusivities that are “apparent” (i.e., model approximations) rather than “true” measures of restricted self-diffusion.
Figure 5
Figure 5
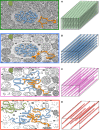
The “diffusion regimes.” (A) White matter is a complex—but relatively ordered— microstructure primarily composed of nerve fibers (axons) and glial cells. Axons are bundled together; their main role is to transport substances intra-cellularly through microtubules and conduct electricity to enable inter-communication between cells. The myelin sheath—a “fatty” insulating layer around the axons—facilitates such conduction. In the healthy brain, such microstructure exerts restrictive boundary conditions to water diffusion. (B) The exact mechanism by which microstructural damage occurs in neurodegenerative diseases is unknown but it is conceivable that, after a period of instability, demyelinative and other axon degeneration processes will lead to longer “diffusion paths.” If therefore, the diffusion time is sufficiently long and the gradients sufficiently strong, such diffusion behavior will yield a change in signal attenuation that will be reflected in tensor diffusivities. (C) If, however, some diffusing molecules cease to interact with microstructural barriers during a given diffusion time, the axial to radial relationship would be dependent on the local geometry leading to heterogeneous tensor behaviors across the brain. (D) In the extreme case, where the diffusion time is too short for molecular displacements to be hindered, tensor diffusivity measures would be unable to detect further change. Large b-values—enabling long diffusion times and strong gradients—make the diffusion measurement with magnetic resonance both more sensitive to subtle microstructural alterations in highly restricted environments, and less prone to diffusion-time dependencies.
Figure 6
Figure 6
Comparison of DTI parametric maps with different b-value, number of b-values (Nb) and number of b0 scans (Nb0). MRI measurements were performed on a Siemens Verio 3T system (Siemens Medical Systems, Erlangen, Germany)—gradient coils capable of 45 mT/m and 200 T/m/s slew rate—with a 32-channel phased-array head-coil. Diffusion volumes were acquired using a standard twice-refocused, single-shot EPI pulse sequence: repetition/echo time = 9000/94 ms; matrix, 120 × 120; 63 contiguous slices aligned parallel to the anterior commissure/posterior commissure line; voxel size: 2 × 2 × 2 mm3; 7/8-phase partial Fourier; bandwidth of 1667 Hz/pixel and echo spacing of 0.68 ms. Diffusion gradients were applied along Nd = 30 non-collinear directions (Siemens default vectors) with Nb = 2 non-zero b-values (b = 700 and 1000 s/mm2), and Nb0 = 12 reference scans. Parallel imaging was enabled (GRAPPA, acceleration factor = 2 and 38 reference lines), leading to a total scan time of 11 min and 15 s. DTI maps were computed with standard tools from FSL's diffusion toolbox. (Left to right columns): (i) Nb = 1 (b = 700 s/mm2), Nb0 = 1 (5:06); (ii) Nb = 1 (b = 1000 s/mm2), Nb0 = 1 (5:06); (iii) Nb = 2 (b = 700 and 1000 s/mm2), Nb0 = 1 (9:36); (iv) Nb = 2 (b = 700 and 1000 s/mm2), Nb0 = 12 (11:15).
Figure 7
Figure 7
White matter tracts that are usually prone to measurement error. (A) The body of the corpus callosum (top arrow) and the body of the fornix (bottom arrow) are often problematic because they are adjacent to cerebrospinal fluid. The cingulum bundle, (B) which is typically less vulnerable at the level of the posterior cingulate, (C) is sometimes prone to partial volume contamination and other types of measurement error in the parahippocampal region due to its thinner physical appearance (Jones et al., 2013a) and its closer proximity to rostral temporal areas known to be affected by magnetic susceptibility artifacts. Note in addition that orbitofrontal white matter is also vulnerable to such artifacts.
Figure 8
Figure 8
Tract-based spatial statistics (TBSS) processing pipeline. (Left to right) DTI-derived fractional anisotropy (FA) images are co-registered to a template; they are then averaged, from which a “skeleton” containing all major tract centers common to all subjects is derived. Skeleton voxels with low FA-values (typically FA < 0.2) are excluded to ensure only white matter is present. Next, spatially normalized FA images are projected to the skeleton. In this step, the center of each tract is identified for each individual FA image, and projection vectors to their analogous location in the skeleton are computed and applied. Transformation fields (to template space) and projection vectors (to the skeleton) are then also applied to the additional DTI parametric maps (i.e., MD, λ1, RD). Finally, non-parametric, permutation based, statistical testing of the null-hypothesis is performed.
Figure 9
Figure 9
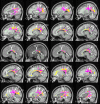
TBSS in AD. TBSS results for N = 43 early-stage AD patients (age: 70 ± 6, <MMSE > = 24 ± 4) vs. N = 26 matched controls (age: 68 ± 6) (Acosta-Cabronero et al., 2012). Pink clusters denote increased MD in patients, whereas those in yellow represent FA reductions at P < 0.05 enabling threshold free cluster enhancement (TFCE) (Smith and Nichols, 2009) and controlling the family-wise error (FWE) rate. Thresholded statistical maps are overlaid onto the TBSS skeleton and MNI152 template. Sagittal MNI coordinates are given in millimeter where x < 0 is left. Abbreviations: [SLF] superior longitudinal fasciculus; [SS] sagittal stratum; [CR] corona radiata; [s/b/gCC] splenium/body/genu of the corpus callosum; [CGc/h] cingulum at the level of the posterior cingulate/parahippocampus; and [FX] fornix.
Figure 10
Figure 10
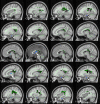
TBSS in very mild AD. TBSS results for N = 21 very mild AD patients (age: 72 ± 5, <MMSE > = 26 ± 2) vs. N = 26 matched controls (age: 68 ± 6) (Acosta-Cabronero et al., 2012). The patient group included N = 16 subjects who were scanned with a diagnosis of mild cognitive impairment but were subsequently shown to have probable AD with longitudinal follow-up. Black clusters denote increased λ1 in patients at PFWE < 0.05, whereas those in blue represent changes with post-hoc control over the false discovery rate (FDR) at q < 0.05. Thresholded statistical maps are overlaid onto the TBSS skeleton and MNI152 template. Sagittal coordinates are given in millimeter (x < 0 is left). Abbreviations: [aTh] anterior thalamic white matter; [CGh] cingulum at the level of the hippocampus; and [FX] fornix.

Similar articles

Cited by

References

    1. Aboitiz F., Scheibel A. B., Fisher R. S., Zaidel E. (1992). Fiber composition of the human corpus callosum. Brain Res. 598, 143–153 10.1016/0006-8993(92)90178-C - DOI - PubMed
    1. Acosta-Cabronero J., Alley S., Williams G. B., Pengas G., Nestor P. J. (2012). Diffusion tensor metrics as biomarkers in Alzheimer's disease. PLoS ONE 7:e49072 10.1371/journal.pone.0049072 - DOI - PMC - PubMed
    1. Acosta-Cabronero J., Williams G. B., Pengas G., Nestor P. J. (2010). Absolute diffusivities define the landscape of white matter degeneration in Alzheimer's disease. Brain 133, 529–539 10.1093/brain/awp257 - DOI - PubMed
    1. Alexander D. C., Barker G. J. (2005). Optimal imaging parameters for fiber-orientation estimation in diffusion MRI. Neuroimage 27, 357–367 10.1016/j.neuroimage.2005.04.008 - DOI - PubMed
    1. Alger J. R. (2012). The diffusion tensor imaging toolbox. J. Neurosci. 32, 7418–7428 10.1523/JNEUROSCI.4687-11.2012 - DOI - PMC - PubMed

LinkOut - more resources