. 2014 Oct 15;34(42):14128-46.
doi: 10.1523/JNEUROSCI.3491-13.2014.

Adult neural precursor cells from the subventricular zone contribute significantly to oligodendrocyte regeneration and remyelination

Affiliations

Adult neural precursor cells from the subventricular zone contribute significantly to oligodendrocyte regeneration and remyelination

Yao Lulu Xing et al. J Neurosci. .

Abstract

Parenchymal oligodendrocyte progenitor cells (pOPCs) are considered the principal cell type responsible for oligodendrogenesis and remyelinaton in demyelinating diseases. Recent studies have demonstrated that neural precursor cells (NPCs) from the adult subventricular zone (SVZ) can also generate new oligodendrocytes after demyelination. However, the relative contribution of NPCs versus pOPCs to remyelination is unknown. We used in vivo genetic fate mapping to assess the behavior of each progenitor type within the corpus callosi (CCs) of mice subjected to cuprizone-induced demyelination. Nestin-CreER(T2) and Pdgfra-CreER(T2) transgenic mice were crossed with fluorescent Cre reporter strains to map the fate of NPCs and pOPCs respectively. In cuprizone-challenged mice, substantial numbers of NPCs migrated into the demyelinated CC and contributed to oligodendrogenesis. This capacity was most prominent in rostral regions adjacent to the SVZ where NPC-derived oligodendrocytes significantly outnumbered those generated from pOPCs. Sixty-two percent of all nodes of Ranvier in this region were flanked by at least one paranode generated from an NPC-derived oligodendrocyte. Remarkably, g-ratios (ratio of the axon diameter to the diameter of the axon plus myelin sheath) of myelinated axons in regions subject to significant NPC-derived remyelination were equivalent to those of unchallenged controls, and immunoelectron microscopy revealed that NPC-derived myelin was significantly thicker than that generated by pOPCs, regardless of axonal caliber. We also demonstrate that a reduced efficiency of remyelination in the caudal CC was associated with long-term impairment in the maturation of oligodendrogenic NPCs but only transient delay in pOPC differentiation. Collectively, our data define a major distinct role for NPCs in remyelination, identifying them as a key target for enhancing myelin repair in demyelinating diseases.

Keywords: demyelination; multiple sclerosis; myelin; neural precursor cells; oligodendrocyte progenitor cells; remyelination.


Figures

Figure 1.
Figure 1.
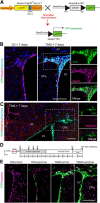
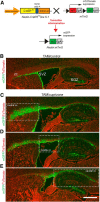
Genetic labeling of NPCs in the adult SVZ. A, Schematic representation of the transgenic alleles in Nestin:YFP mice showing the tamoxifen-responsive recombination of the Rosa26-eYFP allele to induce YFP expression. B, Coronal sections of the SVZ were immunolabeled with antibodies against YFP and Nestin 7 d after oil or tamoxifen administration before cuprizone challenge. Hoechst 33342 was used as a nuclear counterstain. C, Coronal section of the rostral CC immunolabeled with antibodies against YFP and PDGFRα 7 d after tamoxifen administration, and before cuprizone challenge, demonstrating the absence of colocalization of YFP and PDGFRα. D, Experimental design indicating time points for tamoxifen/oil gavage, cuprizone challenge, and tissue collection (black arrowheads). E, Coronal sections of the SVZ immunolabeled with an antibody against YFP and counterstained with Hoechst 33342 at 6 weeks of recovery after cuprizone withdrawal. No YFP expression was observed in oil-treated control mice. A low level of YFP expression was observed in oil-treated mice following cuprizone challenge, indicative of minimal tamoxifen-independent Cre-mediated recombination. Tamoxifen treatment led to YFP expression in both control and cuprizone-challenged mice. Cpu, Caudate-putamen; LV, lateral ventricle. Scale bars, 150 μm.
Figure 2.
Figure 2.
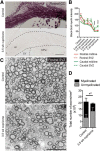
Cuprizone-induced demyelination in the entire CC. A, Representative images of Black-Gold II-stained coronal sections of rostral CC of unchallenged and 3.5 week cuprizone-challenged wild-type mice. Dashed lines indicate borders of the lateral ventricles and CC. B, Quantification of the mean Black-Gold II myelin intensity in the midline of the rostral and caudal CC, and the regions adjacent to the SVZ at the indicated time points. C, Representative electron micrographs of the region of the CC adjacent to the SVZ in unchallenged and 3.5 week cuprizone-challenged wild-type mice. D, Stacked histograms displaying the total number of myelinated (black) and unmyelinated (gray) axons in control versus cuprizone-exposed mice (*ap < 0.05, unpaired two-tailed Student's t test for myelinated axons). Cpu, Caudate-putamen: LV, lateral ventricle. Scale bars: A, 250 μm; C, 5 μm. Mean ± SEM values are shown.
Figure 3.
Figure 3.
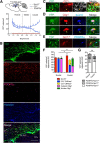
Identity of YFP+ NPC-derived cells within the remyelinating CC. A, YFP labeling of adult NPC-derived cells was observed in coronal sections of the CC of tamoxifen-gavaged Nestin:YFP mice at 6 weeks of recovery after cuprizone withdrawal (TAM/cuprizone), compared with their unchallenged control counterparts (TAM/control). B, Pooled data demonstrating a 23-fold increase in total YFP+ NPC-derived cells in the remyelinating CC of cuprizone-challenged mice compared with unchallenged control mice. C, High-magnification confocal images of a Sox10+ YFP+ cell (top) and a GFAP+ YFP+ cell (bottom) in the CC of a TAM/cuprizone mouse. D, YFP+ cell fate in TAM/cuprizone-challenged Nestin:YFP mice at the 6 week recovery time point. Data are expressed as the percentage of YFP+ cells identified as Sox10+ oligodendroglia (red), GFAP+ astrocytes (blue), Dcx+ immature neuroblasts (white), or Sox10+ GFAP+ cells (gray). The fate of NPC-derived cells did not significantly differ between rostral, middle, and caudal CC. Cpu, Caudate-putamen; LV, lateral ventricle; SGZ, subgranular zone; SVZ, subventricular zone. Scale bars: A, 150 μm; C, 25 μm. Mean ± SEM are shown.
Figure 4.
Figure 4.
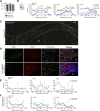
Analysis of the distribution of NPC-derived oligodendroglia within the rostrocaudal axis of the remyelinating CC. A, Top, Schematic representation of a sagittal section through an adult mouse brain highlighting the rostral, middle, and caudal segments of the CC that were analyzed. Bottom, Plot of the distribution of YFP-labeled Sox10+, CC1+, or PDGFRα+ cells along the rostrocaudal axis of CC of cuprizone-challenged mice. Cell counts were obtained from coronal sections. The data represent the mean density of cells within each segment of CC measured from the midline to lateral extent. B, YFP-labeled CC1+ or PDGFRα+ cells in the remyelinating rostral CC adjacent to the SVZ of the cuprizone-challenged mice. Note that the majority of YFP+ cells expressed the oligodendrocyte marker CC1 in this region. C, High-magnification confocal image of a YFP-labeled CC1 CNPase+ cell in the caudal CC adjacent to the SVZ (yellow arrowhead). D, Olig1 was localized in either the nucleus (top, white arrowhead) or the cytosol (bottom, yellow arrowhead) of Sox10+ YFP+ cells within the caudal CC adjacent to the SVZ. E, YFP-labeled Gpr17+ or PDGFRα+ cells within the rostral CC. F, Quantification of NPC-derived oligodendroglia expressing Sox10; CC1+ CNPase+ or CC1 CNPase+; cytosolic or nuclear Olig1 in the rostral and caudal CC adjacent to the SVZ. Two-way ANOVA was used to compare the mean cell density between rostral and caudal segments of the CC (**p < 0.01). G, Quantification of NPC-derived immature OPCs expressing PDGFRα+ and/or Gpr17 in the same analyzed regions. ns, Not significant; CPu, caudate-putamen; LV, lateral ventricle; DL SVZ, dorsolateral corner of SVZ. Scale bars: B, 100 μm; C, 10 μm; D, 20 μm; E, 50 μm. Mean ± SEM values are shown.
Figure 5.
Figure 5.
Assessment of the migration potential of NPCs and pOPCs within the remyelinating CC. A, Total density of CC1+ oligodendrocytes in the rostral, middle, and caudal CC of cuprizone-challenged and control mice that were administered tamoxifen. B, Left, Schematic representation of medial and lateral regions of the CC relative to the dorsolateral corner of SVZ used for quantifying cellular distributions along the mediolateral axis. Right, Mediolateral distribution of NPC-derived oligodendrocytes (CC1+ YFP+ cells, solid blue line); NPC-derived oligodendroglial lineage cells (Sox10+ YFP+ cells, dashed blue line); pOPC-derived oligodendrocytes (CC1+ YFP cells, solid red line); and total oligodendrocytes (CC1+ cells, dashed black line) within the rostral, middle, and caudal segments of the CC of TAM/cuprizone Nestin:YFP mice after 6 weeks of recovery. C, Confocal micrograph of fate-mapped pOPCs in the rostral CC of a TAM/cuprizone-challenged Pdgfra:YFP mouse examined 6 weeks after cuprizone withdrawal. YFP-expressing cells appear as white cell bodies. CC is indicated by the white dashed line. D, Higher magnification of the midline CC (top) and the region adjacent to the SVZ (bottom) of a TAM/cuprizone-challenged Pdgfra:YFP mouse at the 6 week recovery time point revealing the cellular expression of YFP, CC1, and/or PDGFRα. Nuclei were counterstained with Hoechst 33342. E, Mediolateral distribution of pOPC-derived oligodendrocytes (CC1+ YFP+ cells) within the rostral, middle, and caudal segments of the CC of TAM/cuprizone (green) and TAM/control (black) Pdgfra:YFP mice. F, Frequency distribution of pOPC-derived oligodendrocytes (CC1+ YFP+ cells) within the rostral, middle, and caudal segments of the CC of TAM/cuprizone (green) and TAM/control (black) Pdgfra:YFP mice. Scale bars: C, 150 μm; D, top, 100 μm; bottom, 80 μm. Mean ± SEM values are shown.
Figure 6.
Figure 6.
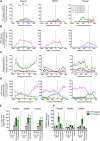
Spatiotemporal analysis of oligodendrogenesis by NPC-derived cells and pOPC-derived cells during cuprizone-induced demyelination and remyelination. A–D, Mediolateral distributions of cell types in the rostral, middle, and caudal segments of the CC of TAM/cuprizone-challenged Nestin:YFP mice. Analyses were performed in mice collected after 2, 3, and 4 weeks of cuprizone challenge, and after 6 weeks recovery following a 6 week cuprizone challenge. A–D, Regional densities are plotted for YFP+ NPC-derived nOPCs expressing PDGFRα (A); YFP+ NPC-derived oligodendrocytes expressing CC1 (B); YFP pOPCs expressing PDGFRα (C); and YFP oligodendrocytes expressing CC1 (D). E, F, Density of CC1+ oligodendrocytes (E) and PDGFRα+ progenitors (F) derived from either pOPCs (YFP, gray) or NPCs (YFP+, green) in the region of the CC adjacent to the SVZ. TAM/cuprizone-challenged Nestin:YFP mice were examined at 2, 3, and 4 weeks of cuprizone challenge and after 6 weeks recovery following a 6 week cuprizone challenge and compared with unchallenged controls. Two-way ANOVA was used to compare the mean density of YFP+ versus YFP cells at each time point, and within each segment of the CC (*p < 0.05, **p < 0.01, ***p < 0.001, ****p < 0.0001). Mean ± SEM values are shown.
Figure 7.
Figure 7.
Identification of pre-existing oligodendrocytes adjacent to the SVZ at 4 weeks of cuprizone challenge in Pdgfra:YFP mice. A, Confocal micrographs of the rostral CC of TAM/control and TAM/cuprizone Pdgfra:YFP mice labeled with antibodies against YFP and CC1, and stained for the thymidine analog EdU, which was administered during the fourth week of cuprizone challenge. Right, High magnification of the boxed region reveals EdU+ and EdU oligodendrocytes (yellow and white arrowheads, respectively). B, C, Mediolateral distributions of newly generated (EdU+) versus pre-existing (EdU) oligodendrocytes in the rostral, middle, and caudal segments of the CC of TAM/control (B) versus TAM/cuprizone Pdgfra:YFP mice (C). LV, Lateral ventricle. Scale bar, 120 μm. Mean ± SEM values are shown.
Figure 8.
Figure 8.
NPC-derived oligodendrocytes are maintained long term after cuprizone challenge. A, Density of YFP+ and YFP subpopulations of CC1+ oligodendrocytes and Sox10+ oligodendroglia adjacent to the SVZ in rostral and caudal segments of the CC of Nestin:YFP mice assessed at 6 and 14 weeks of recovery after cuprizone withdrawal. B, The relative density of NPC-derived CC1+ oligodendrocytes expressed as a percentage of NPC-derived Sox10+ oligodendroglia revealed that differentiation did not differ between rostral or caudal segments between 6 and 14 weeks of recovery. Two-way ANOVA with Bonferroni's post hoc analysis did not reveal any statistically significant effects. C, The relative density of pOPC-derived CC1+ oligodendrocytes expressed as a percentage of pOPC-derived Sox10+ oligodendroglia was significantly higher at 14 weeks compared with 6 weeks of recovery in rostral and caudal segments. Two-way ANOVA with Bonferroni's post hoc analysis revealed an overall statistically significant effect of the recovery time point (**p < 0.01), and a specific effect of the recovery time point for both rostral and caudal segments (*p < 0.05).
Figure 9.
Figure 9.
The repertoire of NPC-derived cells within the CC during cuprizone-induced demyelination. A, Mediolateral distributions of the total population of YFP+ NPC-derived cells in the rostral, middle, and caudal CC of TAM/cuprizone-challenged Nestin:YFP mice at 2, 3, and 4 weeks of cuprizone challenge. B, Quantification of total YFP+ NPC-derived cells in the CC adjacent to the SVZ revealed a significant recruitment of cells in the rostral and caudal CC starting at 2 weeks of cuprizone challenge, with no significant increase being observed in the middle CC. Two-way ANOVA was used to compare the mean density of YFP+ cells among 2, 3, and 4 weeks of cuprizone challenge for each segment of the CC (**p < 0.01, ****p < 0.0001). C, Percentage of YFP+ cells expressing Sox10, GFAP, and/or Dcx in the rostral, middle, and caudal CC of TAM/cuprizone Nestin:YFP mice examined after 4 weeks of cuprizone challenge. D, Plot of the percentage of YFP+ NPC-derived cells that express CC1 or PDGFRα after 4 weeks of cuprizone challenge. Mean ± SEM values are shown.
Figure 10.
Figure 10.
mGFP labeling of the membranes of NPC-derived cells after Cre-mediated recombination. A, Schematic representation of the transgenic alleles in Nestin:mTmG mice showing tamoxifen-responsive recombination of the Rosa26-mTmG allele to induce mGFP expression. B, Parasagittal section (0.84 mm lateral to bregma) of the CC of a TAM/control Nestin:mT/mG mouse at the 6 week recovery time point immunolabeled with an antibody against GFP. In the control group, mGFP labeling was restricted in the neurogenic niches of SVZ and SGZ, with no expression in the CC. C–E, mGFP-labeled parasagittal sections (range, 0.84–2.40 mm lateral to bregma) of the CC of a TAM/cuprizone Nestin:mTmG mouse assessed at 6 weeks of recovery after cuprizone withdrawal. Dashed line represents the boundaries of nominated rostral, middle, and caudal segments of the CC. Scale bars: B–E, 400 μm.
Figure 11.
Figure 11.
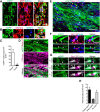
Myelin formation and maintenance of node integrity by mGFP-expressing NPC-derived oligodendrocytes. A, B, Triple-labeling immunohistochemistry on parasagittal sections of TAM/cuprizone Nestin:mTmG mice examined 6 weeks after cuprizone withdrawal. Confocal micrographs of the rostral CC adjacent to the SVZ revealed colocalization of GFP within many MBP- or CNPase-immunoreactive myelin rings that ensheathed SMI312-positive axons (B, white arrowhead). C, mGFP+ myelin rings were present at 16-fold higher density in the rostral compared with the caudal segment of the CC (*p < 0.05, unpaired two-tailed Student's t test). D–G, Triple-labeling immunohistochemistry on coronal sections of rostral CC adjacent to the SVZ revealed that mGFP+ NPC-derived oligodendrocytes ensheathed Nav1.6+ axons. D, An mGFP+ NPC-derived oligodendrocyte (white arrowhead) with numerous CNPase+ processes adjacent to Nav1.6+ nodes of Ranvier. E, F, Nav1.6 nodal expression in axons adjacent to Caspr-associated paranodal sites that were associated with processes either positive (white arrowheads) or negative (yellow arrowheads) for mGFP. G, Confocal z-stack images of Nav1.6-expressing nodal and Caspr-expressing paranodal regions of myelinated axons ensheathed by an mGFP+ NPC-derived oligodendrocyte (white arrowheads). Three sequential optical slices were examined, each of which was 2.5 μm thick. H, Quantification of paranode pairs represented as the number of Caspr-expressing pairs double positive, single positive, or negative for mGFP. Scale bars: A, 3 μm; B, 2 μm; D, 20 μm; E, 10 μm; F, 3 μm; G, 2 μm. Mean ± SEM values are shown.
Figure 12.
Figure 12.
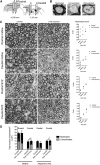
Ultrastructural analysis of myelin integrity in the CC of wild-type cuprizone challenged versus control mice. A, Schematic diagram indicating regions of the CC examined ultrastructurally at the midline and adjacent to the SVZ in both the rostral and caudal segments. B, Representative electron micrographs of myelinated, unmyelinated, and remyelinated axons within the rostral midline C, Left, Electron micrographs of the CC of mice examined at 6 weeks of recovery following a 6 week cuprizone challenge compared with control mice. Right, Mean g-ratios of myelinated axons of small diameter (<0.5 μm), medium diameter (0.5–0.8 μm), and large diameter (>0.8 μm) quantified within the midline CC and in the region of the CC adjacent to the SVZ within the rostral and caudal segments of control (black) and cuprizone-challenged mice (gray). Two-way ANOVA was used to compare g-ratios between control and cuprizone-challenged mice (*p < 0.05, **p < 0.01, ***p < 0.001, ****p < 0.0001). D, Stacked histograms of myelinated (black) and unmyelinated (gray) axon densities in control versus cuprizone-challenged mice. Independent unpaired two-tailed Student's t tests were used to compare differences in either the density of unmyelinated axons (**ap < 0.01) or the density of myelinated axons (*bp < 0.05) between control and cuprizone-challenged mice. Scale bars: B, 0.5 μm; C, 4 μm. Mean ± SEM values are shown.
Figure 13.
Figure 13.
Ultrastructural localization of mGFP within regenerated myelin sheaths of the rostral CC revealed by immunoelectron microscopy. A, Immunogold labeling of mGFP detected in the cilia of NPCs in the SVZ of TAM/cuprizone Nestin:mTmG mice at the 6 week recovery time point. Compared with TAM/cuprizone Nestin:mTmG mice, significantly fewer gold particles (black dots) were detected in the brains of TAM/cuprizone NestinCreERT2 single-transgenic mice that did not carry the mTmG allele, serving as a negative control. B, Gold particles were detected in the pOPC- or NPC-derived myelin sheaths in Pdgfra:mTmG or Nestin:mTmG mice, respectively. C, Electron micrographs of mGFP-labeled myelin identified in Pdgfra:mTmG or Nestin:mTmG mice, as well as unlabeled myelin in Nestin:mTmG mice. Note the differences in myelin thickness despite similar axon caliber and equal magnification. D, Scatterplot of g-ratio against axon diameter for mGFP-labeled myelinated axons in the region adjacent to the SVZ of Nestin:mTmG mice and in the midline region of Pdgfra:mTmG mice. Linear regression analysis of the lines of best fit revealed a significant difference in the y-intercepts (p < 0.0031), but no difference in the slopes (p < 0.36). E, The equivalent scatterplot for mGFP-labeled and unlabeled axons in the region of the CC adjacent to the SVZ of Nestin:mTmG mice assessed at the 6 week recovery time point. Linear regression analysis of the lines of best fit revealed a significant difference in the y-intercepts (p < 0.0001), but no difference in the slopes (p < 0.66). Scale bars: A, 1.5 μm; B, C, 500 nm. Mean ± SEM values are shown.

Similar articles

Cited by

References

    1. Aguirre A, Dupree JL, Mangin JM, Gallo V. A functional role for EGFR signaling in myelination and remyelination. Nat Neurosci. 2007;10:990–1002. doi: 10.1038/nn1938. - DOI - PubMed
    1. Armstrong RC, Le TQ, Frost EE, Borke RC, Vana AC. Absence of fibroblast growth factor 2 promotes oligodendroglial repopulation of demyelinated white matter. J Neurosci. 2002;22:8574–8585. - PMC - PubMed
    1. Arnett HA, Fancy SP, Alberta JA, Zhao C, Plant SR, Kaing S, Raine CS, Rowitch DH, Franklin RJ, Stiles CD. bHLH transcription factor Olig1 is required to repair demyelinated lesions in the CNS. Science. 2004;306:2111–2115. doi: 10.1126/science.1103709. - DOI - PubMed
    1. Blakemore WF, Murray JA. Quantitative examination of internodal length of remyelinated nerve fibres in the central nervous system. J Neurol Sci. 1981;49:273–284. doi: 10.1016/0022-510X(81)90084-8. - DOI - PubMed
    1. Cate HS, Sabo JK, Merlo D, Kemper D, Aumann TD, Robinson J, Merson TD, Emery B, Perreau VM, Kilpatrick TJ. Modulation of bone morphogenic protein signalling alters numbers of astrocytes and oligodendroglia in the subventricular zone during cuprizone-induced demyelination. J Neurochem. 2010;115:11–22. doi: 10.1111/j.1471-4159.2010.06660.x. - DOI - PubMed

Publication types