. 2014 Nov 21;289(47):32871-82.
doi: 10.1074/jbc.M114.593897. Epub 2014 Oct 14.

Conformational rearrangements in the pro-apoptotic protein, Bax, as it inserts into mitochondria: a cellular death switch

Affiliations

Conformational rearrangements in the pro-apoptotic protein, Bax, as it inserts into mitochondria: a cellular death switch

Robert F Gahl et al. J Biol Chem. .

Abstract

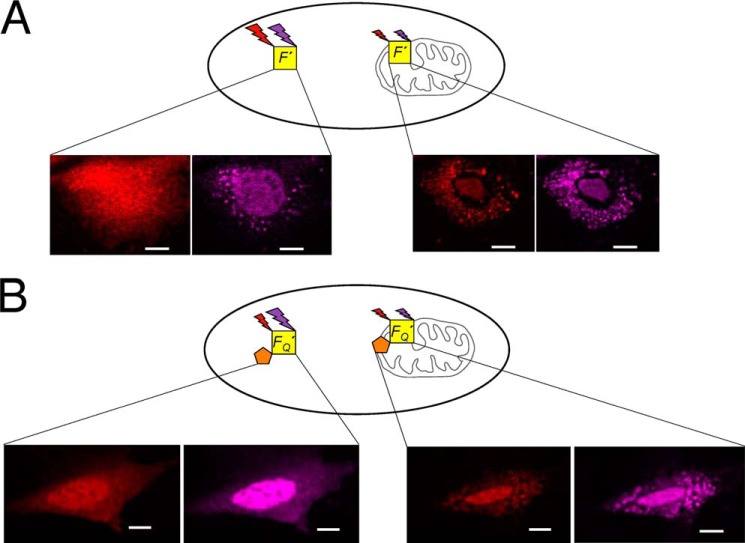
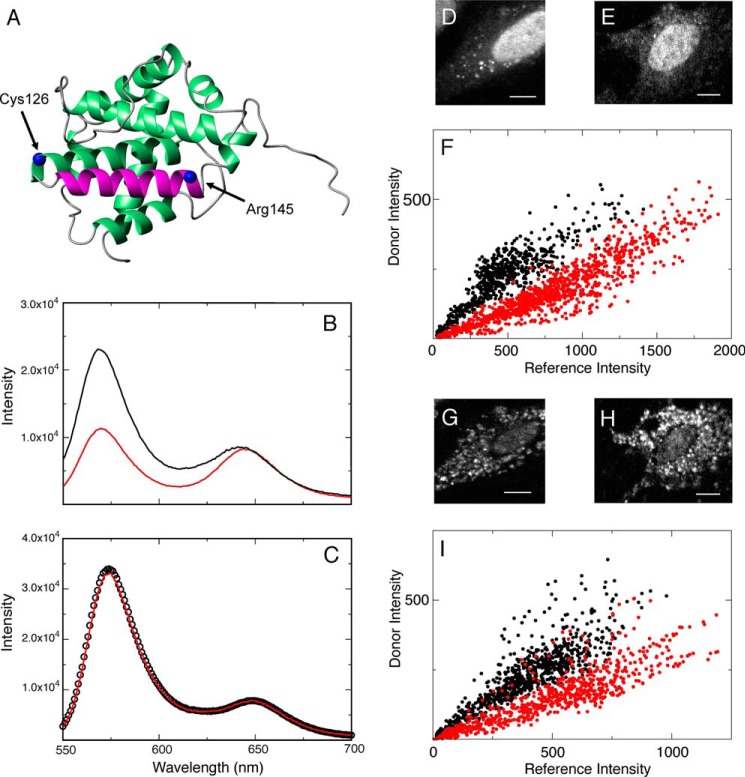
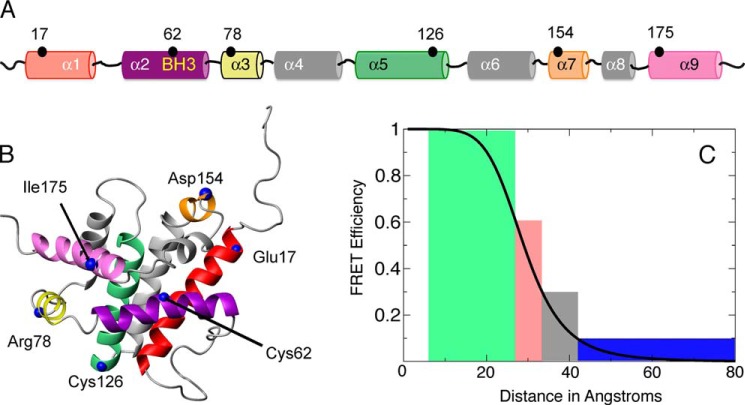
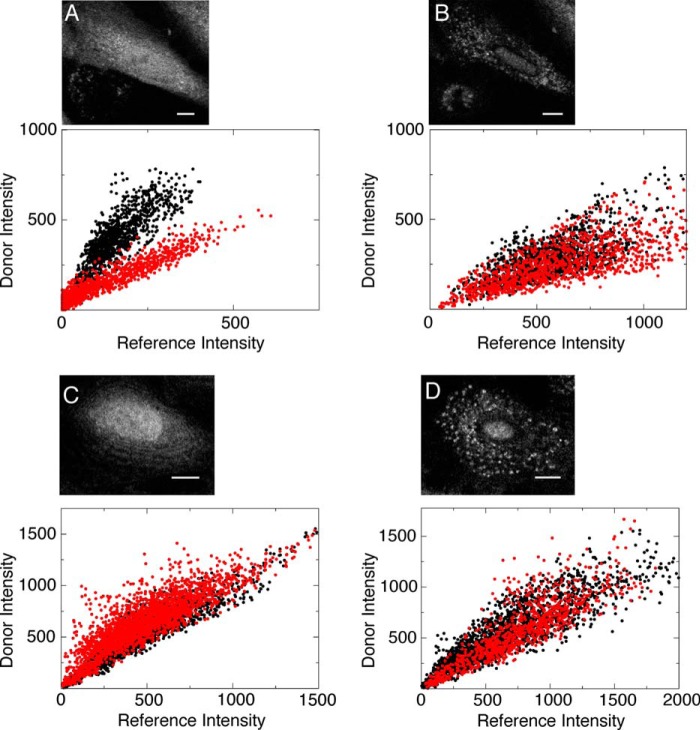
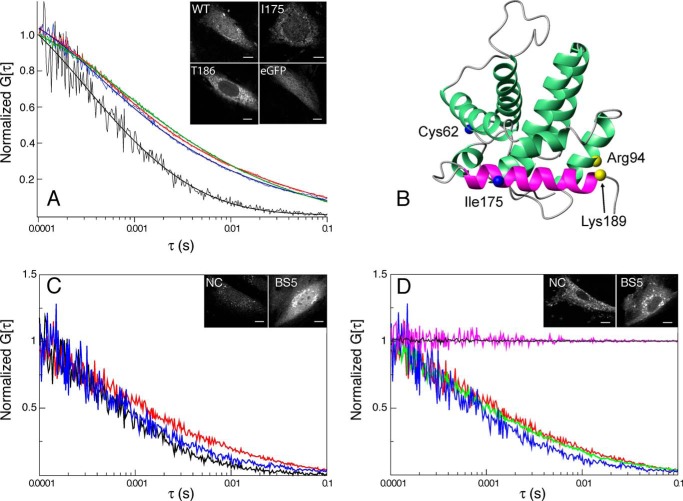
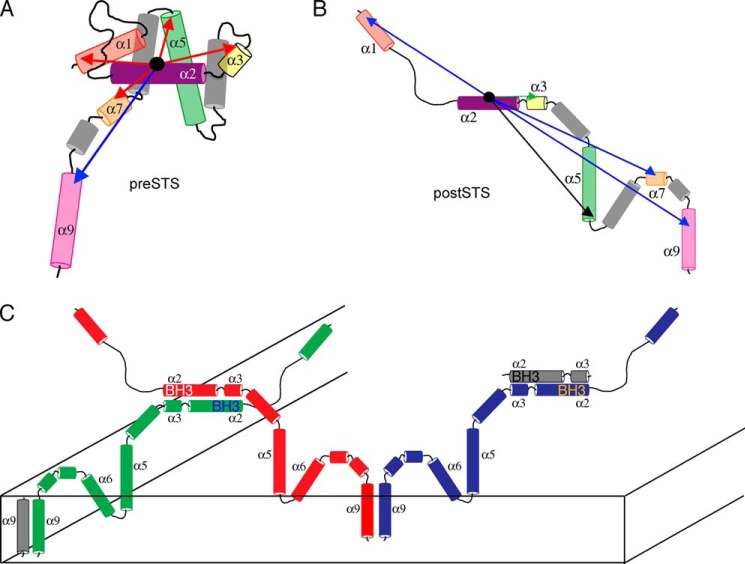
The B-cell lymphoma 2 (Bcl-2) family of proteins regulates the activation of apoptosis through the mitochondria pathway. Pro- and anti-apoptotic members of this family keep each other in check until the correct time to commit to apoptosis. The point of no return for this commitment is the permeabilization of the outer mitochondrial membrane. Translocation of the pro-apoptotic member, Bax, from the cytosol to the mitochondria is the molecular signature of this event. We employed a novel method to reliably detect Förster resonance energy transfer (FRET) between pairs of fluorophores to identify intra-molecular conformational changes and inter-molecular contacts in Bax as this translocation occurs in live cells. In the cytosol, our FRET measurement indicated that the C-terminal helix is exposed instead of tucked away in the core of the protein. In addition fluorescence correlation spectroscopy (FCS) showed that cytosolic Bax diffuses much slower than expected, suggesting possible complex formation or transient membrane interaction. Cross-linking the C-terminal helix (α9) to helix α4 reduced the potential of those interactions to occur. After translocation, our FRET measurements showed that Bax molecules form homo-oligomers in the mitochondria through two distinct interfaces involving the BH3 domain (helix α2) and the C-terminal helix. These findings have implications for possible contacts with other Bcl-2 proteins necessary for the regulation of apoptosis.

Keywords: Apoptosis; B-cell Lymphoma 2 (Bcl-2) Family; Bax; Conformational Change; Fluorescence Correlation Spectroscopy (FCS); Fluorescence Resonance Energy Transfer (FRET).


Figures

FIGURE 1.
FIGURE 1.
A schematic diagram illustrating the utilization of a fluorescent internal reference to detect FRET between Alexa Fluor 546 and Dabcyl during translocation. A, the fluorescence intensities of Bax (F′) conjugated with the FRET donor (Alexa Fluor 546, red) and the internal reference (Alexa Fluor 633, purple) are measured during translocation. B, the fluorescence intensities of another Bax sample, FQ′, that contains the same FRET donor (red) and internal reference (purple) in addition to the non-fluorescent FRET acceptor (Dabcyl, orange) are also measured during translocation. Comparison of the relative intensities of the donor and internal reference with, FQ′, and without, F′, the acceptor under similar conditions would provide FRET efficiency. All scale bars are 10 μm.
FIGURE 2.
FIGURE 2.
Utilization of the C62S/R145C Bax mutant to determine whether the FRET pair Alexa Fluor 546-Dabcyl is sensitive to conformational changes during translocation from the cytosol to the mitochondria. A, the FRET donor and acceptor were conjugated to Cys126 and R145C, which are at opposite ends of helix α6. B, fluorescence spectra of F′ (black) and FQ′ (red) of this mutant in 20 mm Tris, pH 8. C, spectra of the same sample after the addition of 8 m guanidine HCl. D, an MEF cell microinjected with the F′ sample of this mutant before translocation. E, another MEF cell microinjected with the FQ′ sample of this mutant before translocation. F, a scatter plot of the FRET donor (Alexa Fluor 546) and the reference (Alexa Fluor 633) intensities measured at individual pixels on the cells in D and E with (FQ′, red dots, 1033 pixels, r = 0.92) and without (F′, black dots, 710 pixels, r = 0.88) the FRET acceptor (Dabcyl). G, the same cells as in D, which underwent translocation. H, the cell in E, which has undergone translocation. I, a scatter plot analysis, as described in F, but performed on cells in G and H. (F′, black dots, 742 pixels, r = 0.88; FQ′, red dots, 749 pixels, r = 0.87). All scale bars are 10 μm.
FIGURE 3.
FIGURE 3.
Intra-molecular conformational changes in Bax were probed at distinct locations during translocation relative to the BH3 domain. A, various residues that were modified to cysteine, where intra-molecular conformations were measured relative to Cys62 within the BH3 domain are shown in a linear fashion relative to helices in Bax. B, these mutations are represented on the NMR solution structure of Bax (PDB code 1F16). The helices are color coded in A and B similarly. C, the measured FRET efficiencies before and after translocation are categorized into four separate bins. They are displayed on the relationship curve between FRET efficiency and distance for the FRET pair Alexa Fluor 546 and Dabcyl. Efficiencies greater than 60% will be indicated as green color, those between 30 and 60% in red, those between 10 and 30% in black, and those less than 10% in blue.
FIGURE 4.
FIGURE 4.
Mutations and subsequent conjugations to the C terminus of Bax do not affect its activity inside cells. A, scatter plots of the FRET donor and the reference intensities from wild-type Bax microinjected into an MEF cell measured at individual pixels. The lower correlative slope of the sample with the donor (FQ′, red dots, 865 pixels, r = 0.94) compared with the sample without it (F′, black dots, 1091, r = 0.86) indicates FRET between positions Cys126 and Cys62. The inset shows an MEF cell microinjected with Bax and has a diffuse distribution. B, scatter plots from labeled wild-type Bax that has undergone translocation. Unlike the scatter plots in A, the similar correlative slopes of the samples with and without the acceptor, FQ′ (red dots, 1203 pixels, r = 0.76) and F′ (black dots, 1380, r = 0.69), respectively, indicate a loss of FRET efficiency between Cys126 and Cys62. The inset shows the same MEF cell in A that has undergone translocation, where microinjected Bax now has a punctate distribution. C, scatter plot analysis of the C126S/I175C mutant of Bax before translocation. The similar correlative slopes of the samples with and without the acceptor, FQ′ (red dots, 2293 pixels, r = 0.87) and F′ (black dots, 2062 pixels, r = 0.93), respectively, show that there is no FRET between the probes on the BH3 domain and helix α9. Although this efficiency corresponds to this helix being exposed to the solvent and thus has the ability to associate with a membrane environment, it still maintains a diffuse distribution in the cytosol seen in the inset as compared with the wild-type distribution in A. D, scatter plot analysis of the C126S/I175C mutant of Bax after translocation. The scatter plots of samples with and without the acceptor, FQ′ (red dots, 921 pixels, r = 0.86) and F′ (black dots, 2248 pixels, r = 0.91), respectively, have the same correlation slope, which shows that there is no FRET between the probes on the BH3 domain and helix α9 when inserted into the OMM. As seen in the inset, the distribution of this mutant of Bax is now punctate, similar to the distribution of wild-type Bax seen in B. All scale bars are 10 μm.
FIGURE 5.
FIGURE 5.
Determining intracellular diffusion using FCS. A, FCS curves for eGFP (black, 8 curves over 3 cells), WT Bax (red, 8 curves over 3 cells), C126S/I175C mutant Bax (green, 8 curves over 3 cells), and C126S/T186C mutant Bax (blue, 8 curves over 3 cells) before the addition of STS are shown as a function of the correlation time. B, the Cα atoms of the residues used to cross-link helices α9 to α4 using BS(PEG)5 are shown as yellow spheres. Arg94 was mutated to a lysine to utilize N-hydroxysuccinimide ester groups to carry out the cross-linking. C, FCS curves of eGFP (black, 8 curves over 3 cells), cross-linked R94K mutant Bax, BS5 (blue, 15 curves, 5 cells), and R94K mutant Bax with no cross-linking, NC (red, 15 curves over 5 cells) before translocation. D, FCS curves of cross-linked Bax, BS5, before (blue) and after (green, 9 curves over 3 cells) STS was added, as well as, non-cross-linked Bax, NC, before (red) and after (magenta, 9 curves over 3 cells) STS was added. The FCS curve of WT Bax after the addition of STS is also shown (black, 9 curves over 3 cells).
FIGURE 6.
FIGURE 6.
Intermolecular FRET between helices after translocation. Scatter plot analysis of the intensities of the donor and acceptor on individual pixels in the absence (F′, black dots) and presence (FQ′, green dots) of another protein co-injected into cells that contains only the acceptor. A, no FRET is detected between helix α3 at position 78 on one Bax molecule and helix α2 at position 62 on another molecule before translocation as evidenced by the same correlation slope when protein with the acceptor is co-injected (F′, black dots, 1239 pixels, r = 0.86; FQ′, green dots, 2168 pixels, r = 0.75). B, after translocation, FRET is detected between the two sites in A evidenced by the lower correlation slope of the sample that contains the FRET acceptor (F′, black dots, 1049 pixels, r = 0.87; FQ′, green dots, 1720 pixels, r = 0.87). C, there is no contact between helix α5 on separate molecules before translocation evidenced by similar correlation slopes in the presence and absence of the acceptor, which also indicates no FRET (F′, black dots, 1053 pixels, r = 0.89; FQ′, green dots, 1405 pixels, r = 0.75). D, no contact between the sites in C are observed after translocation evidenced by the same correlation slope between the samples with and without the FRET acceptor (F′, black dots, 1405 pixels, r = 0.84; FQ′, green dots, 1668 pixels, r = 0.87). E, no intermolecular contact between helix α9 on separate Bax molecules is observed before translocation evidenced by the same correlation slope between samples with and without the FRET acceptor (F′, black dots, 1367 pixels, r = 0.90; FQ′, green dots, 887 pixels, r = 0.79). F, intermolecular contacts are observed between the sites in E evidenced by the lower correlation slope of the sample with the FRET acceptor (F′, black dots, 1487 pixels, r = 0.78; FQ′, green dots, 825 pixels r = 0.91).
FIGURE 7.
FIGURE 7.
Models for the conformational changes that occur in Bax as a result of translocation and the inter-molecular contacts formed in the OMM. A, FRET efficiencies of Bax determined before translocation, taken from Table 1 and colored according to the bins as described in the legend to Fig. 3C, are illustrated on a proposed model of Bax where the C-terminal helix α9 is exposed. Of the five efficiencies, four correspond to distances that are consistent with the NMR solution structure of Bax. B, FRET efficiencies determined after translocation, taken from Table 1. C, two sites of inter-molecular contact are shown between the BH3 domains of separate Bax molecules as well as between C-terminal helices. The absence of FRET between helices α5 and α6 implies that an oligomeric rather than a dimer architecture is a reasonable model to satisfy these contacts.

Similar articles

Cited by

References

    1. Czabotar P. E., Lessene G., Strasser A., Adams J. M. (2014) Control of apoptosis by the BCL-2 protein family: implications for physiology and therapy. Nat. Rev. Mol. Cell Biol. 15, 49–63 - PubMed
    1. Sassone J., Maraschi A., Sassone F., Silani V., Ciammola A. (2013) Defining the role of the Bcl-2 family proteins in Huntington's disease. Cell Death Dis. 4, e772. - PMC - PubMed
    1. Green D. R. (2004) The pathophysiology of mitochondrial cell death. Science 305, 626–629 - PubMed
    1. Cory S., Adams J. M. (2002) The bcl2 family: regulators of the cellular life-or-death switch. Nat. Rev. Cancer. 2, 647–656 - PubMed
    1. Tait S. W., Green D. R. (2013) Mitochondrial regulation of cell death. Cold Spring Harb. Perspect. Biol. 5, a008706–a008706 - PMC - PubMed

Publication types

MeSH terms