

δEF1 associates with DNMT1 and maintains DNA methylation of the E-cadherin promoter in breast cancer cells
- PMID: 25315069
- PMCID: PMC4312126
- DOI: 10.1002/cam4.347
δEF1 associates with DNMT1 and maintains DNA methylation of the E-cadherin promoter in breast cancer cells
Abstract
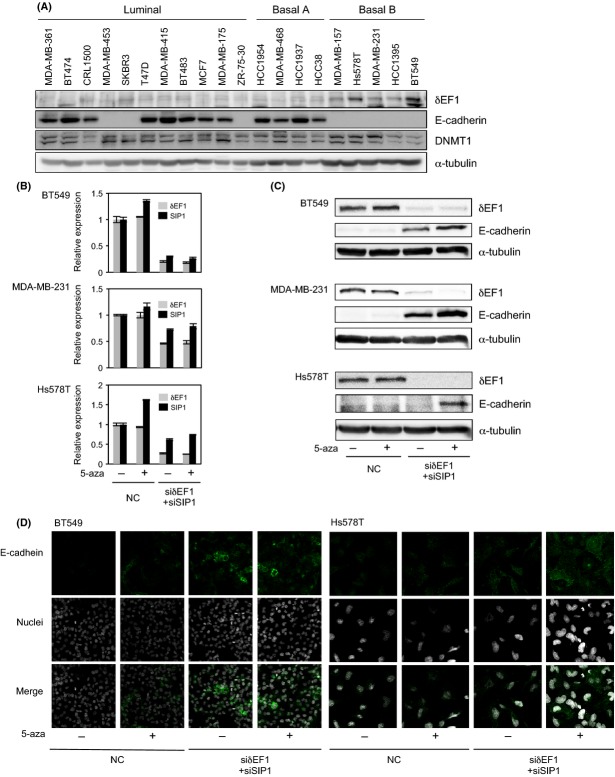
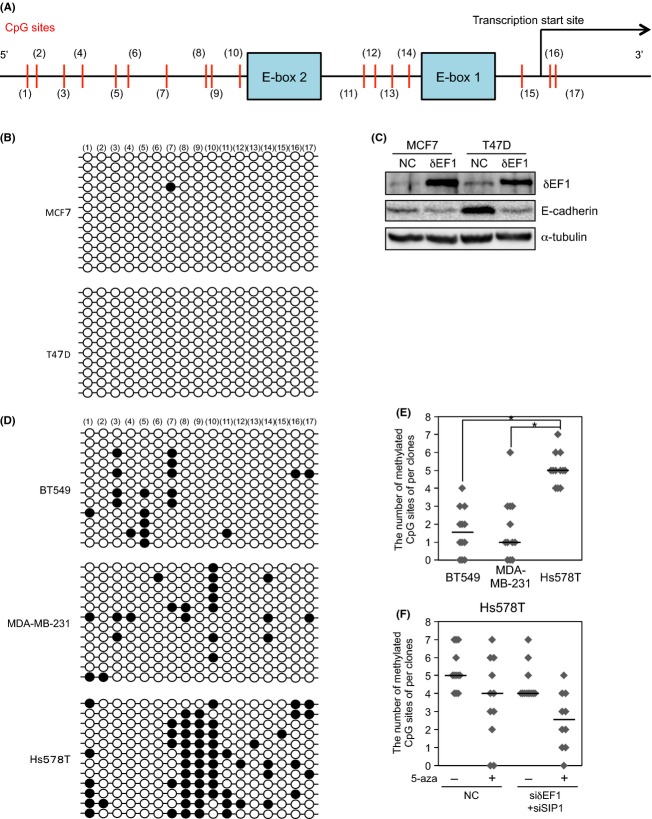
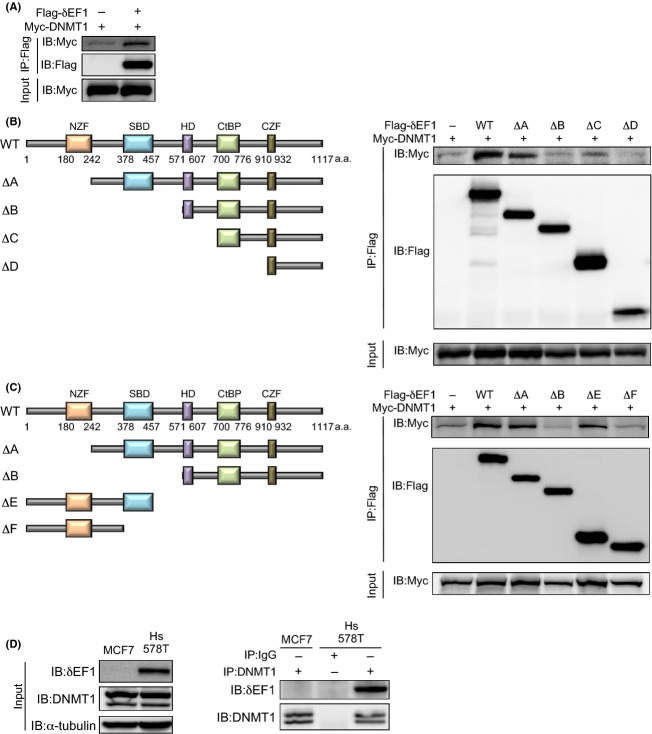
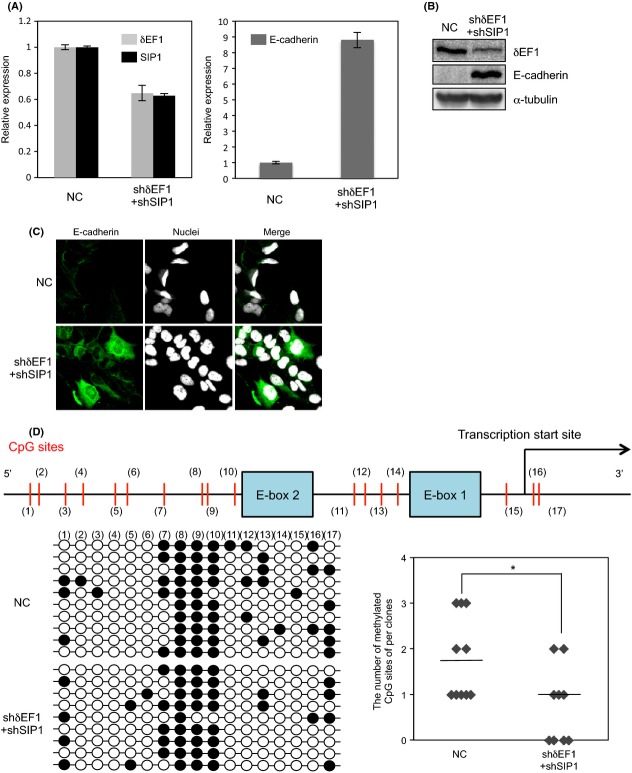
Abnormal DNA methylation at the C-5 position of cytosine (5mC) of CpG dinucleotides is a well-known epigenetic feature of cancer. Levels of E-cadherin, which is regularly expressed in epithelial tissues, are frequently reduced in epithelial tumors due to transcriptional repression, sometimes accompanied by hypermethylation of the promoter region. δEF1 family proteins (δEF1/ZEB1 and SIP1/ZEB2), key regulators of the epithelial-mesenchymal transition (EMT), suppress E-cadherin expression at the transcriptional level. We recently showed that levels of mRNAs encoding δEF1 proteins are regulated reciprocally with E-cadherin level in breast cancer cells. Here, we examined the mechanism underlying downregulation of E-cadherin expression in three basal-type breast cancer cells in which the E-cadherin promoter region is hypermethylated (Hs578T) or moderately methylated (BT549 and MDA-MB-231). Regardless of methylation status, treatment with 5-aza-2'-deoxycytidine (5-aza), which inhibits DNA methyltransferases, had no effect on E-cadherin expression. Knockdown of δEF1 and SIP1 resulted in recovery of E-cadherin expression in cells lacking hypermethylation, whereas combined treatment with 5-aza synergistically restored E-cadherin expression, especially when the E-cadherin promoter was hypermethylated. Moreover, δEF1 interacted with DNA methyltransferase 1 (DNMT1) through the Smad-binding domain. Sustained knockdown of δEF1 family proteins reduced the number of 5mC sites in the E-cadherin promoter region, suggesting that these proteins maintain 5mC through interaction with DNMT1 in breast cancer cells. Thus, δEF1 family proteins appear to repress expression of E-cadherin during cancer progression, both directly at the transcriptional level and indirectly at the epigenetic level.
Keywords: Cancer cells; DNA methylation; E-cadherin; EMT; δEF1.
© 2014 The Authors. Cancer Medicine published by John Wiley & Sons Ltd.
Figures
Similar articles
-
Differential regulation of epithelial and mesenchymal markers by deltaEF1 proteins in epithelial mesenchymal transition induced by TGF-beta.Mol Biol Cell. 2007 Sep;18(9):3533-44. doi: 10.1091/mbc.e07-03-0249. Epub 2007 Jul 5. Mol Biol Cell. 2007. PMID: 17615296 Free PMC article.
-
TGF-β drives epithelial-mesenchymal transition through δEF1-mediated downregulation of ESRP.Oncogene. 2012 Jun 28;31(26):3190-201. doi: 10.1038/onc.2011.493. Epub 2011 Oct 31. Oncogene. 2012. PMID: 22037216 Free PMC article.
-
The miR-200 family and miR-205 regulate epithelial to mesenchymal transition by targeting ZEB1 and SIP1.Nat Cell Biol. 2008 May;10(5):593-601. doi: 10.1038/ncb1722. Epub 2008 Mar 30. Nat Cell Biol. 2008. PMID: 18376396
-
SIP1 (Smad interacting protein 1) and deltaEF1 (delta-crystallin enhancer binding factor) are structurally similar transcriptional repressors.J Bone Joint Surg Am. 2001;83-A Suppl 1(Pt 1):S40-7. J Bone Joint Surg Am. 2001. PMID: 11263664 Review.
-
Interactions between E-cadherin and microRNA deregulation in head and neck cancers: the potential interplay.Biomed Res Int. 2014;2014:126038. doi: 10.1155/2014/126038. Epub 2014 Aug 4. Biomed Res Int. 2014. PMID: 25161999 Free PMC article. Review.
Cited by
-
Intrinsic Balance between ZEB Family Members Is Important for Melanocyte Homeostasis and Melanoma Progression.Cancers (Basel). 2020 Aug 11;12(8):2248. doi: 10.3390/cancers12082248. Cancers (Basel). 2020. PMID: 32796736 Free PMC article. Review.
-
Values of 5mC, 5hmC, and TET2 for identifying the presence and progression of breast precancerous lesion.J Clin Lab Anal. 2020 May;34(5):e23162. doi: 10.1002/jcla.23162. Epub 2019 Dec 22. J Clin Lab Anal. 2020. PMID: 31867779 Free PMC article.
-
Epithelial-Mesenchymal Plasticity in Cancer Progression and Metastasis.Dev Cell. 2019 May 6;49(3):361-374. doi: 10.1016/j.devcel.2019.04.010. Dev Cell. 2019. PMID: 31063755 Free PMC article. Review.
-
Complex Determinants of Epithelial: Mesenchymal Phenotypic Plasticity in Ovarian Cancer.Cancers (Basel). 2017 Aug 9;9(8):104. doi: 10.3390/cancers9080104. Cancers (Basel). 2017. PMID: 28792442 Free PMC article. Review.
-
Ultraviolet A irradiation induces senescence in human dermal fibroblasts by down-regulating DNMT1 via ZEB1.Aging (Albany NY). 2018 Feb 16;10(2):212-228. doi: 10.18632/aging.101383. Aging (Albany NY). 2018. PMID: 29466247 Free PMC article.
References
-
- Ringner M, Staaf J. Jonsson G. Nonfamilial breast cancer subtypes. Methods Mol. Biol. 2013;973:279–295. - PubMed
-
- Charafe-Jauffret E, Ginestier C, Monville F, Finetti P, Adélaïde J, Cervera N, et al. Gene expression profiling of breast cell lines identifies potential new basal markers. Oncogene. 2006;25:2273–2284. - PubMed
-
- Thiery JP, Acloque H, Huang RY. Nieto MA. Epithelial-mesenchymal transitions in development and disease. Cell. 2009;139:871–890. - PubMed
Publication types
MeSH terms
Substances
LinkOut - more resources
Full Text Sources
Other Literature Sources
Medical
Research Materials
Miscellaneous
