. 2014 Oct 14:11:173.
doi: 10.1186/s12974-014-0173-8.

Molecular profile of cochlear immunity in the resident cells of the organ of Corti

Affiliations

Molecular profile of cochlear immunity in the resident cells of the organ of Corti

Qunfeng Cai et al. J Neuroinflammation. .

Abstract

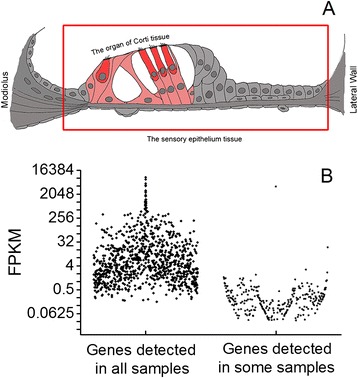
Background: The cochlea is the sensory organ of hearing. In the cochlea, the organ of Corti houses sensory cells that are susceptible to pathological insults. While the organ of Corti lacks immune cells, it does have the capacity for immune activity. We hypothesized that resident cells in the organ of Corti were responsible for the stress-induced immune response of the organ of Corti. This study profiled the molecular composition of the immune system in the organ of Corti and examined the immune response of non-immune epithelial cells to acoustic overstimulation.

Methods: Using high-throughput RNA-sequencing and qRT-PCR arrays, we identified immune- and inflammation-related genes in both the cochlear sensory epithelium and the organ of Corti. Using bioinformatics analyses, we cataloged the immune genes expressed. We then examined the response of these genes to acoustic overstimulation and determined how changes in immune gene expression were related to sensory cell damage.

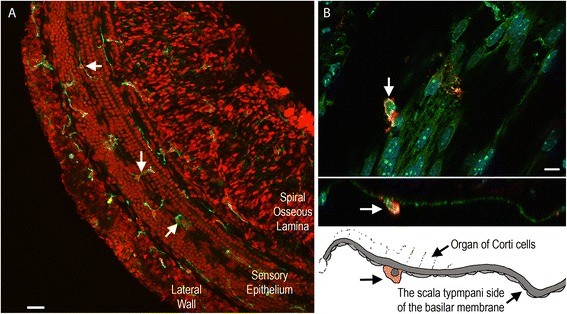
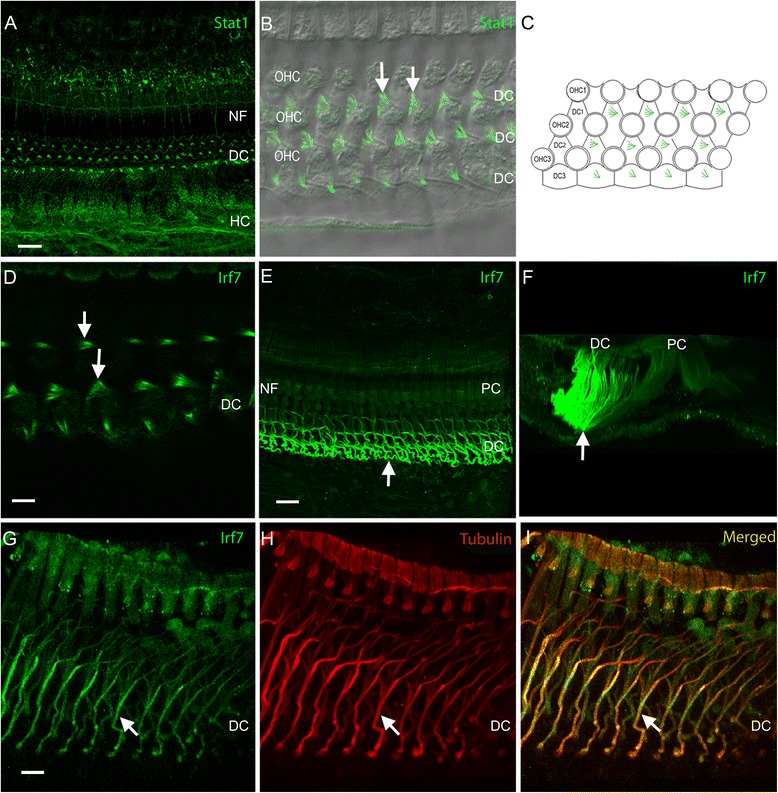
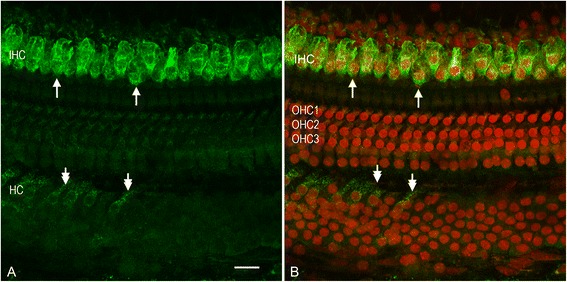
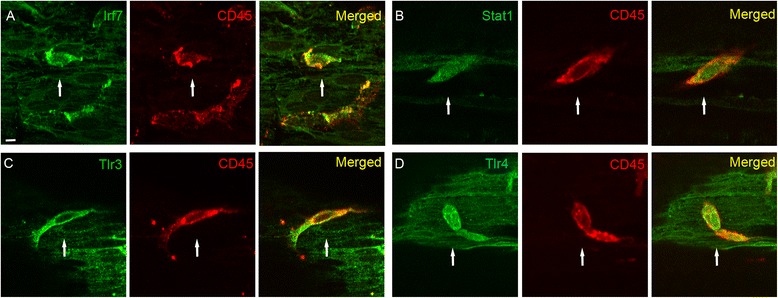
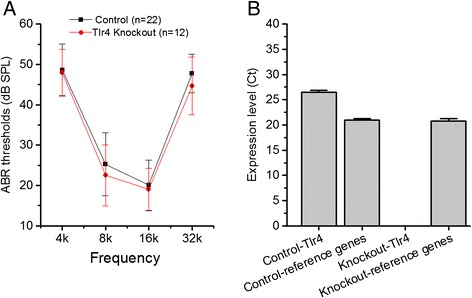
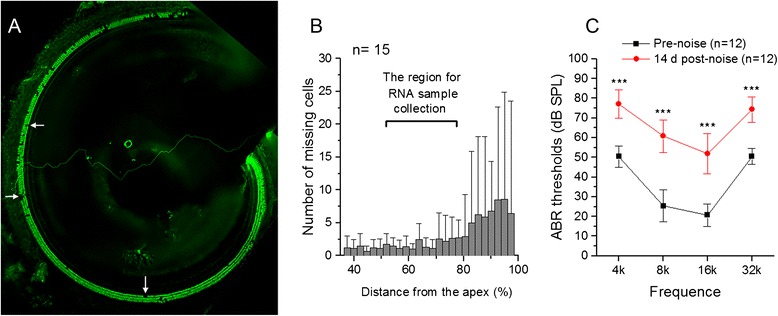
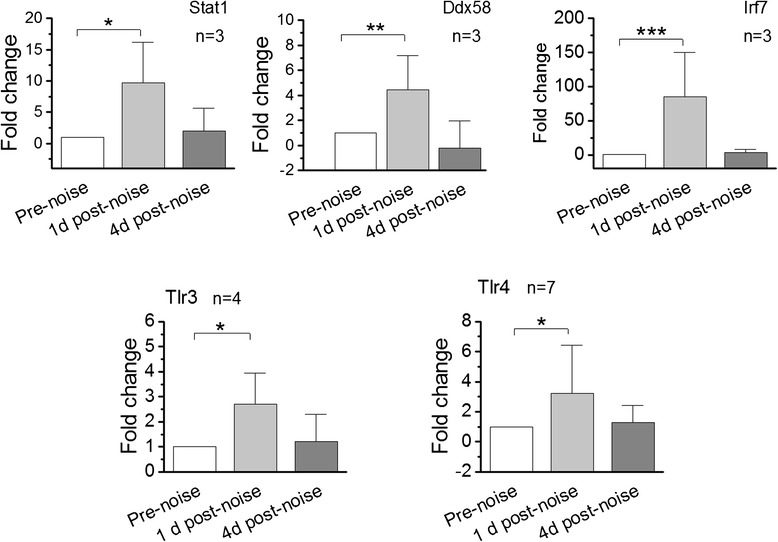
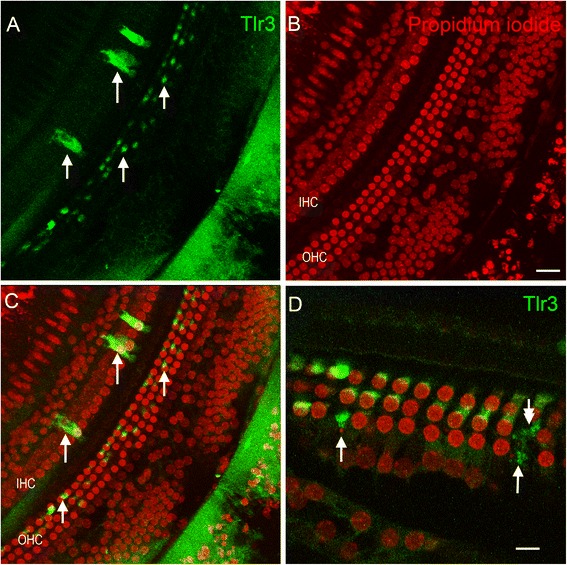
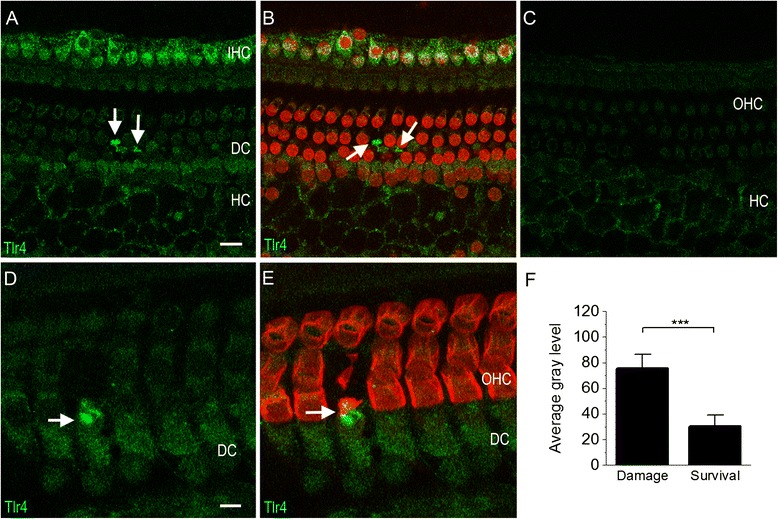
Results: The RNA-sequencing analysis reveals robust expression of immune-related genes in the cochlear sensory epithelium. The qRT-PCR array analysis confirms that many of these genes are constitutively expressed in the resident cells of the organ of Corti. Bioinformatics analyses reveal that the genes expressed are linked to the Toll-like receptor signaling pathway. We demonstrate that expression of Toll-like receptor signaling genes is predominantly from the supporting cells in the organ of Corti cells. Importantly, our data demonstrate that these Toll-like receptor pathway genes are able to respond to acoustic trauma and that their expression changes are associated with sensory cell damage.

Conclusion: The cochlear resident cells in the organ of Corti have immune capacity and participate in the cochlear immune response to acoustic overstimulation.


Figures

Figure 1
Figure 1
The regions of sample collection and expression levels of immune genes. (A) Schematic drawing of a cross-section of the cochlear sensory epithelium. The red rectangle marks the cell populations of the sensory epithelium that were collected for the RNA-seq analysis. The cells in red or pink comprise the organ of Corti, which consists of sensory hair cells (red) and supporting cells (pink). This tissue was collected for qRT-PCR array and individual qRT-PCR analysis of immune gene expression. (B) Expression pattern of immune/inflammatory genes in the cochlear sensory epithelium. Comparison of the expression levels of the immune genes that were detected in all examined samples with those that were detected in some samples. One dot represents the expression of one gene. The genes detected in all samples display a higher average expression level than those that were detected in some samples (Mann-Whitney Rank Sum Test, P <0.001).
Figure 2
Figure 2
Typical images of immune cell distribution in the cochlea. (A) Distribution of immune cells, which were marked by CD45 immunolabeling (green fluorescence marked by arrows) in a whole mount preparation of the cochlea. The tissue was doubly labeled with propidium iodide (red fluorescence), a nuclear dye, to illustrate the tissue structure. Immune cells are present in the lateral wall, the sensory epithelium and the spiral osseous lamina. (B) Typical images showing the location of immune cells in the region of the sensory epithelium. Top panel: a surface view of the basilar membrane. The immune cells labeled with CD45 (red fluorescence) reside alongside spindle-shaped mesothelial cells. The arrow points to an immune cell. The middle panel: a side view of the basilar membrane presented in the top panel. The bottom panel: a schematic drawing of the middle panel image. The arrow points to the immune cell illustrated also in the middle panel. Note that this immune cell is located in the scala tympani side of the basilar membrane.
Figure 3
Figure 3
Immunoreactivity of Stat1 and Irf7 in the organ of Corti. (A) Stat1 immunoreactivity in the organ of Corti cells. The immunoreactivity is present in the phalangeal process of Deiters cells (also see (B) and (C) for a high magnification view), Hensen cells, as well as nerve fibers in the inner hair cell region and in the tunnel of Corti. Sensory cells lack immunoreactivity. (B) A high magnification view of Stat1 immunolabeling in the phalangeal processes of Deiters cells. The Stat1 immunostaining is superimposed with a differential interference contrast (DIC) view of the tissue to illustrate the contour of the outer hair cells and Deiters cells. Note that Stat1 immunoreactivity is present in the phalangeal processes of Deiters cells (arrows). (C) A schematic drawing of the surface view of the organ of Corti mimicking the image (B) . (D) Immunolabeling of Irf7 in the phalangeal process of Deiters cells (arrows). The distribution of Irf7 immunoreactivity in this region is similar to that observed for Stat1. (E) Strong immunoreactivity is present in Deiters cell bodies (marked by the arrow). Weak immunoreactivity is present in pillar cells. Sensory cells lack immunolabeling. (F) A side view of the image in (E) showing the strong Irf7 immunoreactivity in Deiters cells, marked by the arrow. (G), (H), and (I) Double-staining of Irf7 and β-tubulin. The Irf7 immunoreactivity and the β-tubulin immunoreactivity are co-localized in the central core of Deiters cells (the arrow). Bar in (A) = 20 μm and Bar in (G) =15 μm. DC: Deiters cells; HC: Hensen cells; NF: nerve fibers; OHC: outer hair cells; PC: pillar cells.
Figure 4
Figure 4
Immunoreactivity of Tlr4 in the organ of Corti. (A) A typical image of Tlr4 immunostaining in the organ of Corti. (B) Nuclear staining of the same tissue with propidium iodide. Strong Tlr4 immunoreactivity was found in inner hair cells, marked by the top two arrows. Hensen cells display weak immunoreactivity, marked by the bottom two arrows. Outer hair cells and Deiters cells lack immunoreactivity. HC: Hensen cells. OHC1, OHC2 and OHC3: the first, second and third row of outer hair cells. Bar: 20 μm.
Figure 5
Figure 5
Immune protein expression in immune cells in the scala tympani side of the basilar membrane. (A) Double-labeling of Irf7 (green fluorescence) and CD45 (red fluorescence), an immune cell marker. (B) Double-labeling of Stat1 (green fluorescence) and CD45. (C) Double-labeling of Tlr3 (green fluorescence) and CD45. (D) Double-labeling of Tlr4 (green fluorescence) and CD45. The arrow points to an immune cell. Bar =10 μm.
Figure 6
Figure 6
Maintenance of auditory function in Tlr4 knockout mice. (A) Comparison of the ABR thresholds between Tlr4 knockout mice and wild-type mice at four tested frequencies. There is no significant difference in the thresholds between the 2 types of mice (2-way ANOVA, P >0.05), indicating that disruption of the Tlr4 signaling pathway does not affect auditory function. (B) Transcriptional expression levels of Tlr4 in the organ of Corti of Tlr4 knockout and wild-type mice examined by qRT-PCR. The average expression levels of three reference genes (Hprt1, Hsp90ab1, Rpl13a) in the same samples are also present. The expression of Tlr4 was not detected in the Tlr4 knockout mice. This observation confirms that the knockout mice lack Tlr4 expression.
Figure 7
Figure 7
Structural damage and functional loss of the cochleae examined at 14 days after exposure to an intense noise at 120 dB sound pressure level (SPL) for 1 hour. (A) Typical pathology of the outer hair cells in the first cochlear turn, from which the organ of Corti tissue was collected for the transcriptional analysis. The tissue was stained for prestin to illustrate outer hair cells. Arrows point to the areas of missing cells. Note that outer hair cell losses are sporadically distributed in the basal turn of the cochlea. (B) A cochleogram showing the distribution of hair cell lesions in the basal part of the cochlea (35 to 100% from the apex). The bracket indicates the region from which the organ of Corti tissue was collected for the transcriptional analysis. (C) Comparison of ABR thresholds tested before and two weeks after noise exposure. The acoustic overstimulation caused a relatively flat threshold elevation with an average threshold shift ranging from 23.8 to 35.4 dB at the four tested frequencies (2-way ANOVA, F = 403.8, df: 1,88, P = 0). n = the number of cochleae used for each condition.
Figure 8
Figure 8
Expression changes of five genes related to the Toll-like receptor signaling pathway in the organ of Corti after exposure to intense noise at 120 dB sound pressure level (SPL) for 1 hour. The expression levels were measured 1 day post noise exposure using qRT-PCR. n = the number of biological repeats. Notice that these examined genes display a significant up-regulation at 1 day post noise exposure. *P <0.05, **P <0.01, ***P <0.001.
Figure 9
Figure 9
Typical images of Tlr3 immunoreactivity in the sensory epithelium representing the cochlear section at the distance approximately 70% from the apex. The tissues were examined 1 day after noise exposure. (A) Tlr3 immunoreactivity. (B) Propidium iodide staining of the same tissue. (C) Superimposed (A) and (B). Arrows show the sensory cells with the increased Tlr3 immunoreactivity. (D) High magnification view of sensory cells in a section of the basal turn of the cochlea. Arrows indicate an increase in Tlr3 immunoreactivity in outer hair cells with nuclear fragments. The double-arrow indicates an outer hair cell area that has no nuclear staining, suggest degradation of the nucleus. These images show that damaged outer hair cells display an increase in Tlr3 protein immunoreactivity. Bar in (B) =25 μm and Bar in (D) =10 μm. IHC: inner hair cells. OHC: outer hair cells.
Figure 10
Figure 10
Typical images of Tlr4 immunoreactivity of the sensory epithelium from cochleae collected 1 day after acoustic trauma. (A) Tlr4 immunoreactivity is present in inner hair cells and Hensen cells. Arrows indicate increased Tlr4 immunoreactivity in the Deiters cell region. (B) Image (A) is superimposed with propidium iodide staining to illustrate the nuclear morphology. Notice that Tlr4 fluorescence (marked by the arrows) is located in the Deiters cells adjacent to the areas of missing nuclear staining of outer hair cells, indicating that the increase in Tlr4 in Deiters cells is associated with sensory cell damage. (C) A typical image showing that outer hair cells exhibit only weak Tlr4 immunoreactivity. Notice that the image of inner hair cells in this figure is not shown because the inner hair cell image is out of the optical layer of the confocal image. (D) and (E) A typical example of the increase in Tlr4 immunoreactivity in a Deiters cell beneath a degenerated outer hair cell. The tissue was doubly stained with prestin (red fluorescence), an outer hair cell specific protein, to illustrate the bodies of outer hair cells (E). The arrow in (D) and (E) indicates an outer hair cell with a malformed cell body, an indication of ongoing degeneration. The Deiters cell beneath this degenerating outer hair cell displays increased Tlr4 immunoreactivity. (F) Comparison of the gray level of staining intensity between the Deiters cells beneath surviving outer hair cells and the Deiters cells beneath dying outer hair cells. The average of the fluorescence intensity in the Deiters cells beneath dying outer hair cells is significantly higher than the Deiters cells beneath the surviving outer hair cells (Student’s t-test, P <0.001). DC: Deiters cells; HC: Hensen cells; IHC: inner hair cells; OHC: outer hair cells.

Similar articles

Cited by

References

    1. Hu BH, Henderson D, Nicotera TM. Involvement of apoptosis in progression of cochlear lesion following exposure to intense noise. Hear Res. 2002;166:62–71. doi: 10.1016/S0378-5955(02)00286-1. - DOI - PubMed
    1. Nakashima T, Teranishi M, Hibi T, Kobayashi M, Umemura M. Vestibular and cochlear toxicity of aminoglycosides - a review. Acta Otolaryngol. 2000;120:904–911. doi: 10.1080/00016480050218627. - DOI - PubMed
    1. Keithley EM, Feldman ML. Hair cell counts in an age-graded series of rat cochleas. Hear Res. 1982;8:249–262. doi: 10.1016/0378-5955(82)90017-X. - DOI - PubMed
    1. Iwai H, Lee S, Inaba M, Sugiura K, Baba S, Tomoda K, Yamashita T, Ikehara S. Correlation between accelerated presbycusis and decreased immune functions. Exp Gerontol. 2003;38:319–325. doi: 10.1016/S0531-5565(02)00177-8. - DOI - PubMed
    1. Iwai H, Baba S, Omae M, Lee S, Yamashita T, Ikehara S. Maintenance of systemic immune functions prevents accelerated presbycusis. Brain Res. 2008;1208:8–16. doi: 10.1016/j.brainres.2008.02.069. - DOI - PubMed

Publication types

MeSH terms