. 2014 Nov 13;515(7526):274-8.
doi: 10.1038/nature13800. Epub 2014 Oct 12.

A three-dimensional human neural cell culture model of Alzheimer's disease

Affiliations

A three-dimensional human neural cell culture model of Alzheimer's disease

Se Hoon Choi et al. Nature. .

Abstract

Alzheimer's disease is the most common form of dementia, characterized by two pathological hallmarks: amyloid-β plaques and neurofibrillary tangles. The amyloid hypothesis of Alzheimer's disease posits that the excessive accumulation of amyloid-β peptide leads to neurofibrillary tangles composed of aggregated hyperphosphorylated tau. However, to date, no single disease model has serially linked these two pathological events using human neuronal cells. Mouse models with familial Alzheimer's disease (FAD) mutations exhibit amyloid-β-induced synaptic and memory deficits but they do not fully recapitulate other key pathological events of Alzheimer's disease, including distinct neurofibrillary tangle pathology. Human neurons derived from Alzheimer's disease patients have shown elevated levels of toxic amyloid-β species and phosphorylated tau but did not demonstrate amyloid-β plaques or neurofibrillary tangles. Here we report that FAD mutations in β-amyloid precursor protein and presenilin 1 are able to induce robust extracellular deposition of amyloid-β, including amyloid-β plaques, in a human neural stem-cell-derived three-dimensional (3D) culture system. More importantly, the 3D-differentiated neuronal cells expressing FAD mutations exhibited high levels of detergent-resistant, silver-positive aggregates of phosphorylated tau in the soma and neurites, as well as filamentous tau, as detected by immunoelectron microscopy. Inhibition of amyloid-β generation with β- or γ-secretase inhibitors not only decreased amyloid-β pathology, but also attenuated tauopathy. We also found that glycogen synthase kinase 3 (GSK3) regulated amyloid-β-mediated tau phosphorylation. We have successfully recapitulated amyloid-β and tau pathology in a single 3D human neural cell culture system. Our unique strategy for recapitulating Alzheimer's disease pathology in a 3D neural cell culture model should also serve to facilitate the development of more precise human neural cell models of other neurodegenerative disorders.


Figures
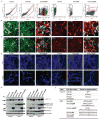
Extended Data Figure 1
Extended Data Figure 1. Generation of FACS-sorted ReN cells with FAD mutations
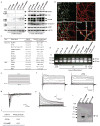
a. FACS sorting of ReNcell VM human neural stem (ReN) cells that were stably transfected with polycistronic GFP and/or mCherry lentiviral Vector. The cells were then enriched based on GFP and/or mCherry signals by FACS (red-dotted boxes, the selected ranges of cells for the experiments). b. ReN cells stably expressing GFP alone (ReN-G), APPSL/GFP (ReN-GA), APPSL/GFP/PS1ΔE9/mCherry (ReN-mGAP), mCherry alone (ReN-m), APPSL/PS1ΔE9/mCherry (ReN-mAP) or GFP/APPSL/PS1ΔE9/mCherry (HReN-mGAP). Green, GFP; Red, mCherry; Scale bar, 25 μm. c. The representative fluorescence microscope images of ReN cells that were differentiated by growth-factor deprivation for 3 weeks (green, GFP; red, mCherry; scale bar, 25 μm). d. IF of neuronal (Tuj-1, blue) and glial markers (GFAP, blue) in 3-week differentiated control and FAD ReN cells. e. WB of APPSL and PS1ΔE9 expression in control (ReN-G and ReN-m) and FAD ReN (ReN-GA, ReN-mGAP and HReN-mGAP) cells. APP C-terminal fragments levels were largely increased by 500 nM DAPT treatments for 24 hours. f. A table summarizing the control and FAD ReN cells generated for this study.
Extended Data Figure 2
Extended Data Figure 2. Characterization of the control and FAD ReN cells
a. WB of neuronal (MAP2, Tuj1, NCAM, Synapsin 1) and glial (GFAP) markers in undifferentiated and 3-week differentiated control and FAD ReN cells. b. Confocal IF of presynaptic (VGluT1, green) and dendritic (MAP2, red (pseudo-colored)) markers in 6-week differentiated control ReN-m cells. c. qPCR array analysis of neuronal and glial markers of 7-week differentiated control ReN-G cells. Gene expression levels were normalized against β-actin levels in each sample and the fold changes were calculated by setting the expression levels of each genes in undifferentiated control ReN-G cells as 1 (n=3 for ReN-G while n=5 for ReN-G in 3D-differentiatiation). FAD (HReN-mGAP and ReN-mAP) ReN cells showed a similar pattern of increases in neuronal and glial markers (data not shown). d. Analysis of 4-repeat (4R) or 3-repeat (3R) tau isoforms in 7-week differentiated control (ReN-G and ReN-m) and FAD (ReN-GA, ReN-mGAP, HReN-mGAP and ReN-mAP) ReN cells. cDNA samples prepared from undifferentiated control ReN-G (1st lane) and human adult brains (9th lane) were used as controls. e and f. Electrophysiological properties of differentiated control ReN-G cells. The currents were elicited by 10 mV voltage steps from -100 to +60 mV in external solution (e) without (left panel in f) or with 500 nM tetrodotoxin (TTX, right panel in f). TTX treatment specifically blocked voltage-gated sodium currents. ReN-G cells were differentiated for 29 days by the “preD” method as previously described. g. Sodium currents are shown as subtracted currents. h. Premature ReN-G (<16 days) cells mostly showed voltage-gated potassium currents without TTX-sensitive sodium currents. i. WB of Aβ levels in the conditioned media collected from 6-week differentiated control (ReN-m) and FAD ReN (ReN-mAP and HReN-mGAP) cells. j. A table summarizing APOE genotypes of control (ReN-m) and FAD ReN (ReN-mAP) cells used in this study. Two APOE SNP markers rs429358 (minor allele=C) and rs7412 (minor allele=T) were used to determine APOE2/3/4 genotypes.
Extended Data Figure 3
Extended Data Figure 3. Characterization of differentiated ReN cells in 3D cultures
a. Hematoxylin staining of a representative paraffin section (10 μm) from 9-week differentiated ReN-m cells in thick layer 3D Matrigel. The sections were vertically cut to show the top and bottom of the 3D cultures. The digital pictures were serially taken from top to bottom and combined together (bottom panel: an enlarged picture). b. The paraffin sections from control (ReN-G and ReN-m) and FAD ReN (ReN-GA and ReN-mAP (enriched)) were IF stained with the following antibodies against neuronal markers, Tuj1 and MAP2. Blue, DAPI; scale bar, 25 μm. c. IF of thick layer 3D-differentiated ReN-m cells with the following antibodies against additional neuronal markers. Green, tau, VGluT1 (Vesicular glutamate transporter 1), or GluR2 (Glutamate Receptor, Ionotropic, AMPA 2); scale bar, 25 μm. d. IF of 3D-differentiated ReN-m cells (7 weeks) with the antibodies against mature neuronal markers. Green, TH (tyrosine hydroxylase), NR2B (NMDA receptor 2B) or GABA(B)R2 (GABB-B-receptor 2); Blue, DAPI; scale bar, 20 μm.
Extended Data Figure 4
Extended Data Figure 4. Reconstitution of Aβ aggregates in 3D-cultured FAD ReN cells
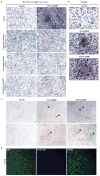
a. IHC of Aβ deposits in control (ReN-G) and FAD ReN (HReN-mGAP) cells differentiated in 3D Matrigel. The control and FAD ReN cells were 3D-differentiated for 6 weeks and then treated with 1 μM BACE1 inhibitor IV (β-secretase inhibitor), 500 nM DAPT (γ-secretase inhibitor), 500 nM SGSM41 (γ-secretase modulator) or DMSO for additional 3 weeks. The cultures were then fixed and immunostained with HRP-conjugated BA27 anti-Aβ40 antibodies (brown, DAB (BA27); blue, hematoxylin; scale bar, 25 μm; arrowheads, large Aβ deposits). b. The enlarged images of Aβ deposits in control (ReN-G) and FAD ReN (ReN-mGAP, HReN-mGAP) cell pictures shown in Fig. 2d and Extended Data Fig. 4a). c. IHC of Aβ deposits in control (ReN-G, left panels) and FAD ReN (ReN-mGAP: middle panels; HReN-mGAP: right panels) cells differentiated in 3D thin layer Matrigels for 9 weeks. The fixed thin-layer 3D cultures were immunostained with HRP-conjugated BA27 anti-Aβ40 antibodies (brown, DAB (BA27); scale bar, 25 mm; arrows, large Aβ deposits). d. Amylo-Glo staining of ReN-G 3D cultures. Green, GFP; Blue, Amylo-Glo.
Extended Data Figure 5
Extended Data Figure 5. Accumulation of p-tau in FAD ReN cells
a. Elevated p-tau levels were significantly decreased by 1 μM DAPT (γ-secretase inhibitor) treatment in 6-week differentiated HReN-mGAP cells. The antibody against human specific mitochondrial marker (h-mito) was used to show an equal loading of the samples. b. Quantitation of p-tau levels in control and DAPT-treated HReN-mGAP cells (**, p<0.01; t-test; n=3 per each sample). c. p-tau IHC showed p-tau positive cells in 3D-differentiated FAD ReN cells. Two p-tau antibodies, AT8 (pSer199/Ser202/Thr205) and PHF1 (pSer396/Ser404), against different phosphorylation sites were used. Brown, p-tau; Scale bar, 25 μm; arrows indicate the cells with high levels of p-tau. d. High magnification (1,000x) images of p-tau positive neurons (brown, AT8 p-tau). IHC of AT8 p-tau staining showed neurons with high levels of p-tau accumulation in soma and neurite-like structures (arrowheads). e. IHC of p-tau (AT8) staining showed the cells with p-tau accumulations in soma and neurite-like structures (arrow and arrowheads). f. An enlarged image of a dotted box in e (brown: p-tau (AT8); blue: hematoxylin). g. Total number of cells with high levels of p-tau in single 96-well was counted in control (ReN-G and ReN-m) and FAD ReN (ReN-GA, ReN-mGAP and HReN-mGAP) cells (*, p<0.05; t-test; n=5 for control ReN cells and 12 for FAD ReN cells). h. BACE inhibitor IV (1 μM) or Compound E (3.7 nM) treatments largely decreased cells with high p-tau accumulation in ReN-mAP cells (***, p<0.001; ANOVA followed by a post-hoc Dunnett’s test; n=3 for control ReN-m and ReN-mAP cells).
Extended Data Figure 6
Extended Data Figure 6. FACS enrichment of ReN-mAP and ReN-m cells for higher expressions of APP and PS1
a. FACS sorting of ReN-mAP cells with top 1–2% mCherry signal. b. The enriched control ReN-m and ReN-mAP cells were differentiated by growth-factor deprivation in 2D cultures. c. The enriched ReN-mAP cells secreted high levels of Aβ40 and 42 after 9-week 3D differentiation. The secreted Aβ38/40/42 levels were measured by a multi-array Meso Scale electrochemiluminescence (Meso Scale SQ 120 system). Relative levels of Aβ (fold increases) were calculated by setting Aβ levels of the control ReN-m as 1. Aβ levels were decreased after treating 1 μM BACE1 inhibitor IV, 3.7 nM Compound E or 500 nM SGSM41 (**, p<0.01; ***, p<0.001; ANOVA followed by a post-hoc Dunnett’s test; n=3 for the enriched ReN-m and -mAP, respectively).
Extended Data Figure 7
Extended Data Figure 7. Increased p-tau levels in FAD ReN cells
a. IF of AT8 p-tau and MAP2 in the enriched ReN-mAP and control ReN-m cells after 9 weeks of 3D-differentiation. A BACE1 inhibitor (BACE1 inhibitor IV) treatment for 3 weeks, dramatically reduced AT8 p-tau staining (green, AT8 p-tau; red (pseudo-colored), MAP2; scale bar, 25 μm). b. WB of total and p-tau levels in control (ReN-m) and FAD ReN (enriched ReN-mAP) cells. The cells were 3D-differentiated for 9 weeks. 3 weeks of BACE1 inhibitor treatments significantly decreased p-tau levels without changing total tau levels. HSP70 heat shock protein levels were shown for equal loadings of each sample.
Extended Data Figure 8
Extended Data Figure 8. Immuno-EM analysis of sarkosyl-insoluble fraction from FAD and control ReN cells
a. Sarkosyl-insoluble fractions prepared from 3D-differentiated ReN-mAP (enriched, 7-week differentiated), were placed on carbon grids, labeled with tau46 and anti-mouse 10 nm gold antibodies and imaged by using a JEOL JEM 1011 transmission electron microscope (Scale bar, 500 nm). b. Sarkosyl-insoluble fractions from 3D-differentiated control ReN-G cells (7 weeks). No immunogold-labeled filamentous structures were detected in these samples (Scale bar, 500 nm).
Extended Data Figure 9
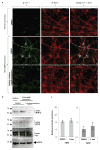
Extended Data Figure 9. 1-Azakenpaullone, a GSK3 inhibitor treatment decreased Aβ-induced tau phosphorylation without changing the total Aβ levels
a. IF of p-tau and MAP2 in the enriched ReN-mAP and control ReN-m cells with or without treating 1-Azakenpaullone, a GSK3β inhibitor. The differentiated cells were treated with 2.5 μM 1-Azakenpaullone (GSK3β inhibitor) or DMSO for the last 5 days of the 3D differentiation (green, p-tau (PHF1); red (pseudo-colored), MAP2; scale bar, 25 μm). b. WB of total and p-tau levels in control (ReN-m) and FAD ReN (enriched ReN-mAP) cells. The cells were 3D-differentiated for 4 weeks followed by additional 5-day treatments of DMSO or 2.5 μM 1-Azakenpaullone. c. Analysis of Aβ40 and 42 levels in the enriched ReN-mAP cells treated with either DMSO or 2.5 μM 1-Azakenpaullone (1-Aza) under the same conditions.
Figure 1
Figure 1. Generation of hNPCs with multiple FAD mutations
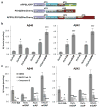
a. Diagrams showing lentiviral IRES constructs. APPSL, APP with Swedish/London mutations; PS1ΔE9, PS1 with ΔE9 mutation; GFP, eGFP. b. Increased Aβ40 and 42 levels in 6-week differentiated FAD ReN cells. Aβ levels in conditioned media were normalized to total protein levels (*, p<0.05; **, p<0.01; ***, p<0.001; ANOVA followed by a post-hoc Dunnett test; n=3 per each sample). c. Aβ levels are dramatically decreased in FAD ReN cells after treatment with 1 μM BACE1 inhibitor IV or 3.7 nM Compound E (mean ± s.e.m; *, p<0.05; **, p<0.01; ***, p<0.001; ANOVA followed by a post-hoc Dunnett test; n=3 per each sample; n.d. not detected).
Figure 2
Figure 2. Robust increases of extracellular Aβ deposits in 3D-differentiated hNPCs with FAD mutations
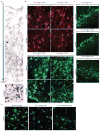
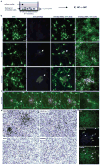
a. Thin layer 3D culture protocols (IF, immunofluorescence; HC, histochemical; IHC, immunohistochemical staining). b. Aβ deposits in 6-week differentiated control and FAD ReN cells in 3D Matrigel (green, GFP; blue, 3D6; scale bar, 25 μm; arrowheads, extracellular Aβ deposits; right-most panels, 3D6 staining was pseudo-colored to red). c. Select confocal z-stack images of 3D6-positive Aβ deposits. Z-sections with an interval of 2 μm were captured and the sections #1,3–4, #6 and #19 are shown (green, GFP; red, 3D6). d. IHC of Aβ deposits in ReN-mGAP cells. 3D-differentiated cells were treated with 1 μM BACE inhibitor IV, 500 nM DAPT, 500 nM SGSM41 or DMSO (brown, DAB (BA27); blue, hematoxylin; scale bar, 25 μm; arrowheads, large Aβ deposits). e. Detection of amyloid plaques with Amylo-Glo, a fluorescent amyloid-specific dye (Green, GFP; blue, Amylo-Glo; arrows, Amylo-Glo positive aggregates).
Figure 3
Figure 3. Elevation of Aβ and p-tau levels in TBS-insoluble fractions of 3D-differentiated FAD hNPCs
a. A diagram showing a thick-layer 3D culture and detergent extraction protocols. b. WB of Aβ aggregates in 3D-differentiated ReN cells. 6E10 antibody detected Aβ monomers, dimers, trimers and tetramers in SDS-soluble (upper panel) and formic acid-soluble fractions (lower panel) from the control (ReN-G and -m) and the FAD ReN cells (ReN-GA, ReN-mGAP and HReN-mGAP) after 6-week differentiation. c. WB of total and p-tau levels in SDS-soluble and formic acid-soluble fractions.
Figure 4
Figure 4. Detection of aggregated p-tau in the enriched ReN-mAP cells
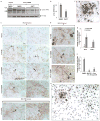
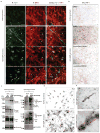
a. IF of p-tau and MAP2 in the enriched ReN-mAP and ReN-m cells after 3D differentiation (green, p-tau (PHF1); red (pseudo-colored), MAP2; scale bar, 25 μm; arrows, p-tau positive neurites; arrowheads, p-tau positive cell bodies). b. IHC of p-tau in the enriched ReN-mAP and ReN-m cells after 10-week 3D differentiation. The cells were treated with 1 μM BACE1 Inhibitor IV, 3.7 nM compound E or DMSO for the final two weeks of the 3D differentiation. PHF1 antibody detected the elevated levels of p-tau in soma and neurites (brown, p-tau; scale bar, 25 μm). c. WB of total and p-tau levels in 1% sarkosyl-soluble and -insoluble fractions. d. The modified Gallyas silver staining showed robust increases of strong silver deposits in cell bodies and neurite-like structures in the enriched ReN-mAP cells (lower panel) but not in ReN-m cells (upper panel; scale bar, 25 μm). e. Tau filaments were detected in sarkosyl-insoluble fractions from the enriched ReN-mAP cells by transmission electron microscopy (7-week 3D differentiation; black dots, anti-tau (tau46) antibodies labeled with immunogold anti-mouse antibodies; scale bar, 100 nm). Lower panel: an enlarged image (arrowheads indicate filamentous structures).

Comment in

Similar articles

Cited by

References

    1. Tanzi RE, Bertram L. Twenty years of the Alzheimer’s disease amyloid hypothesis: a genetic perspective. Cell. 2005;120:545–555. - PubMed
    1. Hardy J, Selkoe DJ. The amyloid hypothesis of Alzheimer’s disease: progress and problems on the road to therapeutics. Science. 2002;297:353–356. - PubMed
    1. Selkoe D. Alzheimer’s disease is a synaptic failure. Science. 2002;298:789–791. - PubMed
    1. Duff K. Transgenic mouse models of Alzheimer’s disease: phenotype and mechanisms of pathogenesis. Biochem Soc Symp. 2001;67:195–202. - PubMed
    1. Chin J. Selecting a mouse model of Alzheimer’s disease. Methods Mol Biol. 2011;670:169–189. - PubMed

Publication types

MeSH terms