. 2014 Oct 2;514(7520):59-64.
doi: 10.1038/nature13786.

Biogeography and individuality shape function in the human skin metagenome

Collaborators, Affiliations

Biogeography and individuality shape function in the human skin metagenome

Julia Oh et al. Nature. .

Abstract

The varied topography of human skin offers a unique opportunity to study how the body's microenvironments influence the functional and taxonomic composition of microbial communities. Phylogenetic marker gene-based studies have identified many bacteria and fungi that colonize distinct skin niches. Here metagenomic analyses of diverse body sites in healthy humans demonstrate that local biogeography and strong individuality define the skin microbiome. We developed a relational analysis of bacterial, fungal and viral communities, which showed not only site specificity but also individual signatures. We further identified strain-level variation of dominant species as heterogeneous and multiphyletic. Reference-free analyses captured the uncharacterized metagenome through the development of a multi-kingdom gene catalogue, which was used to uncover genetic signatures of species lacking reference genomes. This work is foundational for human disease studies investigating inter-kingdom interactions, metabolic changes and strain tracking, and defines the dual influence of biogeography and individuality on microbial composition and function.


Figures

Extended Data Figure 1
The 18 selected skin sites and their location on the human body. These sites represent three microenvironments: sebaceous (blue), dry (red), and moist (green). Toenail (black) is a site that does not fall under these major microenvironments and is treated separately. Pie charts represent consensus relative abundance of the kingdoms Bacteria, Eukaryota (Fungi), and Virus from multi-kingdom mapping.
Extended Data Figure 2
Per-sample read statistics. Additional samples (bacterial and eukaryotic mock communities) are shown. a, Boxplots (line indicates median; boxes represent first and third quartiles) show, for each site, % reads mapping to human hg19 that are discarded prior to analysis. Sites are colored by site characteristic. b, Samples are ordered by label. Lines indicate the median value for that statistic; value is in parenthesis. c, Estimate of sequencing coverage. Reads seen is the number of reads in a sample sampled. Reads are then split into 20-mers, compared to a k-mer coverage table and kept only if the median k-mer coverage is below 20×. Curves are grouped by site, colored by individual as indicated.
Extended Data Figure 3
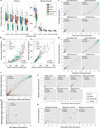
Validation of taxonomic classifications. a, Bacterial sample community diversity as a function of genome coverage for two diversity metrics, the Shannon index that measures the richness and evenness of the community (left), and # species observed (right). Genome coverage is defined as for each genome hit, the % of genome covered by reads. Boxplots show the range of diversity values for all samples, segregated by microenvironment. Black lines indicate median; boxes represent first and third quartiles. As coverage cutoffs increase, diversity estimates drop sharply. b, Comparisons of bacterial community diversity for Metaphlan-derived classifications vs. custom bacterial Pathoscope-derived classifications. Each point represents a different sample, colored by microenvironment. With no coverage cutoffs (left), Pathoscope may overestimate diversity, which is reduced by setting a minimum 1× coverage requirement. Spearman correlation (ρ) and corresponding P-values are shown. Pathoscope-derived relative abundances versus relative abundances derived from c, 16S amplicon sequencing, d, Metaphlan genus-level, e, Metaphlan-species level (ρ & P-value are calculated for non-zero abundance taxa) f, Metaphlan, staphylococcal species, g, ITS1 amplicon sequencing, genus (ρ & P-value are calculated for non-zero abundance taxa) and h, ITS1 amplicon sequencing, Malassezia species.
Extended Data Figure 4
Full taxonomic classifications for all healthy volunteers (HV), all sites. To aid visualization of site- and individual-specific similarities, samples are grouped by site/microenvironment for each individual. Relative abundances of the most abundant skin taxa for each super-kingdom are shown. b, Taxonomic re-classification of major sites sampled by the Human Microbiome Project. Samples are from the anterior nares and retroauricular crease (skin), tongue dorsum and supragingival plaque (oral), stool, and posterior fornix (vaginal). Relative abundances of the most abundant taxa for each kingdom in the skin, for comparison, are shown.
Extended Data Figure 5
Strain-level classification based on reference genomes show sub-species heterogeneity for dominant skin taxa. a, Simulations to assess sensitivity of Pathoscope-based mapping to SNPs, non-core regions, or whole genomes. Synthetic communities were created with 6, 12, or 18 genomes per community. Sizes of circles reflect the number of reads sampled from each genome, e.g., 50,000, 1000,000, or 500,000 reads per genome. 15 random synthetic communities for each genome group were created and mapped to SNPs, non-core regions, or the full genome set. Sensitivity is calculated from the expected vs. the observed abundances. b, Full strain-level assignments for samples with relative abundances of closest related Propionibacterium acnes strains, by individual. c, Dendrograms of strain similarity. Trees were generated using core SNPs; genomes were aligned with nucmer to identify core regions, and then SNPs within these core regions were identified by calculating all pairwise differences between genomes. Bar of colors indicates delineations of subtypes where phylogenetically more similar genomes are in similar colors, e.g., we defined 12 subtypes for P. acnes.
Extended Data Figure 6
Strain-level classification for Staphylococcus epidermidis. a, Full strain-level assignments for samples by microenvironment. b, Description is as in Extended Data Figure 5c. We defined 14 subtypes for S. epidermidis.
Extended Data Figure 7
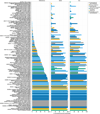
Full version of coreness of different module categories across skin microenvironment. A module is defined as core if occurring in >2/3 of samples for that class. Major KEGG module descriptors are shown in the different colors. Height of bars reflects the proportion of samples that a module occurs in; error bars reflect the variation of the members of that KEGG descriptor and are standard error of the mean.
Extended Data Figure 8
Correlation analysis of module abundance with species abundance to infer a module’s taxonomic origin. Spearman correlation (ρ) was calculated with corresponding P-value for taxa with relative abundance > 0.5% and modules with greater than 0.05% relative abundance. Corynebacterium (Coryn.) a, Unsupervised clustering of correlation coefficients. Species from the same genera clustering together may suggest a shared contribution of a pathway. b, Most significantly correlated taxa; colors represent broad KEGG classes. Adjusted P < 2e-16.
Extended Data Figure 9
Antibiotic resistance profiles in the skin. Reads were mapped to a short marker database consensus created from the ARDB database, which catalogs publicly available resistance genes. Genes are grouped into broad resistance classes; a resistance category is called present (black; absent = white) if at least one gene from its family is present.
Extended Data Figure 10
Reference-free analysis of skin metagenome with adaptive iterative assembly, gene catalog, and metagenomic clusters. a, Tracking unclassified reads. Fraction unmapped reads refers to the fraction of total reads passing quality control that do not map to the major super kingdoms Archaea, Bacteria, Eukaryota, and Viruses. Samples are ordered by label and are divided by site. b, Assembly, gene-calling, and clustering workflow. c, Assembly efficacy varies significantly by kmer depending on the site’s unique features of community complexity and sequencing depth, which is most affected by that site’s human DNA admixture. Assembly statistics are shown for samples pooled by individual, which produced higher quality assemblies than pooling by site. Because of large pool size, khmer digital normalization was used prior to Velvet assembly. % overall alignment rate indicates the total % of reads that map back to that sample’s assembly for each kmer. % paired concordant indicates the fraction paired reads (of overall, not of % paired) in which both pairs of a mate map back to an assembly; discordant is where one mate of a pair does not map, or maps to a different contig. Contigs are then assessed by the maximum assembly size, the number of bases that are used in the assembly, and the number of contigs above a threshold of 300bp. d, Effect of khmer digital normalization on individual sample assembly. Digital normalization + Velvet assembly performs similarly to Velvet assembly alone.
Figure 1
Figure 1
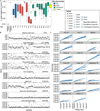
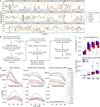
Multi-kingdom relative abundances are strongly shaped by skin microenvironment. a, Boxplots of mean relative abundance of different kingdoms by site; see Extended Data Fig. 1 for site codes. Black lines indicate median; boxes first and third quartiles. Triangles indicate significance (adjusted P < 0.05, Kruskal-Wallis post-hoc test) for over- (up) or under- (down) representation in a majority of pairwise comparisons between sites. b, Kingdoms in HMP body sites. c, Consensus relative abundance plots of major skin taxa by microenvironment. d, Communities cluster primarily by microenvironment with sebaceous regions most distinct in principal components (PC) analysis. Propionibacterium (P.), Staphylococcus (S.), Corynebacterium (C.).
Figure 2
Figure 2
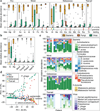
Individual-specific signatures are typically low abundance but shared across most sites. Left, variable importance plot of most discriminatory taxa from random forests analysis. For each individual, center: proportion of the 18 sites in which each taxa is present, and right: mean relative abundance of that taxa across sites. Streptococcus (Str.)
Figure 3
Figure 3
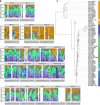
Propionibacterium acnes and Staphylococcus epidermidis are heterogeneous and multiphyletic at the strain level. a, b, Reference genomes used for a, P. acnes and b, S. epidermidis. Leftmost bar shows subtypes (phylogenetically similar genomes) as color groups. Adjacent heatmap shows mean relative abundance by skin microenvironment. Dry (D), moist (M), sebaceous (S), toenail (T). c, d, Select relative abundance plots; strain colors as in a–b. e, f, P. acnes subtypes differ more significantly between individuals than skin microenvironment with the converse observed for S. epidermidis. Boxplots of Yue-Clayton theta indices calculate similarity between (‘inter’) or within (‘intra’) individuals/microenvironments (θ=1: identical). Black lines indicate median; boxes first and third quartiles. P-value, Wilcoxon rank-sum test. g, h, Barcharts show P. acnes and S. epidermidis subtypes that differ by microenvironment or individual. Length of bar represents the fraction of post-hoc tests significant for each comparison; 105 comparisons for individual; 6 for microenvironment. *P < 0.05, adjusted Kruskal-Wallis test.
Figure 4
Figure 4
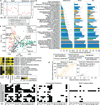
Functional capacity varies by microenvironment. a, Shannon diversity of functional pathways and taxonomy by site; P-value, Kruskal-Wallis test between microenvironments. Error bars: standard error of the mean. b, Microenvironments possess different core modules; ‘core’ = occurrence in > 2/3 of samples. Error bars show variation within a class of modules (full version in Extended Data) that may arise from a unique specialization for that microenvironment. c, PCA shows clustering by microenvironment, with strong separation of sebaceous, dry, and toenail modules. Heatmaps: left, loadings for the first two PCs; right, mean relative abundances for modules with the greatest variation by microenvironment. d, A module’s taxonomic origin can be imputed by Spearman correlation (ρ; adjusted P ≤ 2e-16) with P. acnes and M. restricta relative abundances. e, Presence of select antibiotic resistance gene families by individual and site.
Figure 5
Figure 5
Reconstruction of metagenomic dark matter with reference-free methods. a, Per-sample iterative assembly with variable kmers optimizes assembly quality as assessed by % reads mapping back to assembly (left) and the number of bases incorporated (right). b, Skin gene catalog was mapped to nr and KEGG to identify kingdom and functional category. Density plot compares length of genes with and without homology; gene length was typically larger for unmapped genes. c, Metagenomic clusters represent genes that covary in abundance across samples within a microenvironment; boxplots show cluster sizes; histograms show number of clusters (log10 scale). d, A lowest common ancestor (LCA) was assigned to a cluster with >50% consensus taxonomy. Bar length indicates the total number of ‘genes’ in a cluster; black represents the number of genes mapping to the LCA. Gray represents ambiguous or unannotated genes. “Characterized” indicates that a reference genome exists for that species; for e, “Uncharacterized genomes”, no reference exists. Propionibacterium (P.), Staphylococcus (S.), Corynebacterium (C.)

Comment in

Similar articles

Cited by

References

    1. Grice EA, Segre JA. The skin microbiome. Nat Rev Micro. 2011;9:244–253. - PMC - PubMed
    1. Grice EA, et al. Topographical and Temporal Diversity of the Human Skin Microbiome. Science. 2009;324:1190–1192. - PMC - PubMed
    1. Costello EK, et al. Bacterial Community Variation in Human Body Habitats Across Space and Time. Science. 2009;326:1694–1697. - PMC - PubMed
    1. Findley K, et al. Topographic diversity of fungal and bacterial communities in human skin. Nature. 2013;498:367–370. - PMC - PubMed
    1. Peters BM, Noverr MC. Candida albicans-Staphylococcus aureus Polymicrobial Peritonitis Modulates Host Innate Immunity. Infect. Immun. 2013;81:2178–2189. - PMC - PubMed

Publication types

MeSH terms