White matter consequences of retinal receptor and ganglion cell damage
- PMID: 25257055
- PMCID: PMC4215745
- DOI: 10.1167/iovs.14-14737
White matter consequences of retinal receptor and ganglion cell damage
Abstract
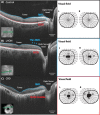
Purpose: Patients with Leber hereditary optic neuropathy (LHON) and cone-rod dystrophy (CRD) have central vision loss; but CRD damages the retinal photoreceptor layer, and LHON damages the retinal ganglion cell (RGC) layer. Using diffusion MRI, we measured how these two types of retinal damage affect the optic tract (ganglion cell axons) and optic radiation (geniculo-striate axons).
Methods: Adult onset CRD (n = 5), LHON (n = 6), and healthy controls (n = 14) participated in the study. We used probabilistic fiber tractography to identify the optic tract and the optic radiation. We compared axial and radial diffusivity at many positions along the optic tract and the optic radiation.
Results: In both types of patients, diffusion measures within the optic tract and the optic radiation differ from controls. The optic tract change is principally a decrease in axial diffusivity; the optic radiation change is principally an increase in radial diffusivity.
Conclusions: Both photoreceptor layer (CRD) and retinal ganglion cell (LHON) retinal disease causes substantial change in the visual white matter. These changes can be measured using diffusion MRI. The diffusion changes measured in the optic tract and the optic radiation differ, suggesting that they are caused by different biological mechanisms.
Keywords: Leber hereditary optic neuropathy; cone-rod dystrophy; diffusion-MRI; white matter.
Copyright 2014 The Association for Research in Vision and Ophthalmology, Inc.
Figures


Similar articles
-
Diffusivity and quantitative T1 profile of human visual white matter tracts after retinal ganglion cell damage.Neuroimage Clin. 2019;23:101826. doi: 10.1016/j.nicl.2019.101826. Epub 2019 Apr 16. Neuroimage Clin. 2019. PMID: 31026624 Free PMC article.
-
Optical Coherence Tomography of the Retinal Ganglion Cell Complex in Leber's Hereditary Optic Neuropathy and Dominant Optic Atrophy.Curr Eye Res. 2019 Jun;44(6):638-644. doi: 10.1080/02713683.2019.1567792. Epub 2019 Feb 4. Curr Eye Res. 2019. PMID: 30649972
-
Axonal damage in the optic radiation assessed by white matter tract integrity metrics is associated with retinal thinning in multiple sclerosis.Neuroimage Clin. 2020;27:102293. doi: 10.1016/j.nicl.2020.102293. Epub 2020 May 26. Neuroimage Clin. 2020. PMID: 32563921 Free PMC article.
-
Leber hereditary optic neuropathy: respiratory chain dysfunction and degeneration of the optic nerve.Vision Res. 1998 May;38(10):1495-504. doi: 10.1016/s0042-6989(97)00444-6. Vision Res. 1998. PMID: 9667014 Review.
-
Role of the macular optical coherence tomography scan in neuro-ophthalmology.J Neuroophthalmol. 2011 Dec;31(4):353-61. doi: 10.1097/WNO.0b013e318238b9cb. J Neuroophthalmol. 2011. PMID: 22089499 Free PMC article. Review.
Cited by
-
CHIASM, the human brain albinism and achiasma MRI dataset.Sci Data. 2021 Nov 26;8(1):308. doi: 10.1038/s41597-021-01080-w. Sci Data. 2021. PMID: 34836950 Free PMC article.
-
Diffusivity and quantitative T1 profile of human visual white matter tracts after retinal ganglion cell damage.Neuroimage Clin. 2019;23:101826. doi: 10.1016/j.nicl.2019.101826. Epub 2019 Apr 16. Neuroimage Clin. 2019. PMID: 31026624 Free PMC article.
-
Optogenetic therapy restores retinal activity in primate for at least a year following photoreceptor ablation.Mol Ther. 2022 Mar 2;30(3):1315-1328. doi: 10.1016/j.ymthe.2021.09.014. Epub 2021 Sep 20. Mol Ther. 2022. PMID: 34547460 Free PMC article.
-
Reply to: Viability of diffusion tensor imaging for assessing retrochiasmatic involvement in Kearns-Sayre syndrome remains elusive.Neuroradiology. 2020 Feb;62(2):133-134. doi: 10.1007/s00234-019-02344-4. Epub 2019 Dec 14. Neuroradiology. 2020. PMID: 31838563 No abstract available.
-
Structural Covariance and Heritability of the Optic Tract and Primary Visual Cortex in Living Human Brains.J Neurosci. 2022 Aug 31;42(35):6761-6769. doi: 10.1523/JNEUROSCI.0043-22.2022. J Neurosci. 2022. PMID: 35853720 Free PMC article.
References
-
- Huang H, Zhang J, van Zijl PCM, Mori S. Analysis of noise effects on DTI-based tractography using the brute-force and multi-ROI approach. Magn Reson Med. 2004; 52: 559–565 - PubMed
Publication types
MeSH terms
Grants and funding
LinkOut - more resources
Full Text Sources
Other Literature Sources

