. 2014 Nov 14;289(46):31891-31904.
doi: 10.1074/jbc.M114.584391. Epub 2014 Sep 24.

γ-Interferon-inducible lysosomal thiol reductase (GILT) maintains phagosomal proteolysis in alternatively activated macrophages

Affiliations

γ-Interferon-inducible lysosomal thiol reductase (GILT) maintains phagosomal proteolysis in alternatively activated macrophages

Dale R Balce et al. J Biol Chem. .

Abstract

Although it is known that lysosomal cysteine cathepsins require a reducing environment for optimal activity, it is not firmly established how these enzymes are maintained in their reduced-active state in the acidic and occasionally oxidative environment within phagosomes and lysosomes. γ-Interferon-inducible lysosomal thiol reductase (GILT) has been the only enzyme described in the endosomes, lysosomes, and phagosomes with the potential to catalyze the reduction of cysteine cathepsins. Our goal in the current study was to assess the effect of GILT on major phagosomal functions with an emphasis on proteolytic efficiency in murine bone marrow-derived macrophages. Assessment of phagosomal disulfide reduction upon internalization of IgG-opsonized experimental particles confirmed a major role for GILT in phagosomal disulfide reduction in both resting and interferon-γ-activated macrophages. Furthermore we observed a decrease in early phagosomal proteolytic efficiency in GILT-deficient macrophages, specifically in the absence of an NADPH oxidase-mediated respiratory burst. This deficiency was more prominent in IL-4-activated macrophages that inherently possess lower levels of NADPH oxidase activity. Finally, we provide evidence that GILT is required for optimal activity of the lysosomal cysteine protease, cathepsin S. In summary, our results suggest a role for GILT in maintaining cysteine cathepsin proteolytic efficiency in phagosomes, particularly in the absence of high NADPH oxidase activity, which is characteristic of alternatively activated macrophages.

Keywords: Cysteine Protease; Lysosome; Macrophage; Oxidation-Reduction (Redox); Phagosome; Proteolysis; Reductase.


Figures

FIGURE 1.
FIGURE 1.
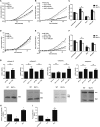
Phagosomal reductive and oxidative processes in GILT−/− BMMØs. BMMØs derived from WT and GILT−/− mice were incubated for 18 h in the presence/absence of IFNγ. A, total mRNA levels of GILT in unactivated and IFNγ-activated BMMØs were determined by QPCR. Averaged relative mRNA levels from four independent QPCR experiments are shown. Relative expression was expressed as mRNA levels relative to 18 S and presented relative to unactivated BMMØs. Error bars denote S.E. *, p < 0.05. 10 min before addition and subsequent phagocytosis of experimental particles, BMMØs were treated with the NOX2 inhibitor DPI (0.5 μm) where indicated. B, C, and D, phagosomal disulfide reduction of the BODIPY FL l-cystine substrate conjugated to IgG-opsonized dextran-coated experimental particles. E and F, phagosomal oxidation of the OxyBURST Green H2HFF BSA substrate conjugated to IgG-opsonized experimental particles. G, extracellular H2O2 production relative to unactivated/untreated WT control after phagocytosis of serum opsonized zymosan particles as measured by oxidation of the Amplex UltraRed reagent. B, C, and E, representative real-time traces. Relative fluorescence units (RFU) values are proportional to the degree of substrate reduction/oxidation. D and F, averaged rates relative to unactivated/untreated WT controls of four independent experiments are shown for each phagosomal measurement. Average relative rates of disulfide reduction were calculated between 40 and 60 min after particle internalization. Relatives rate of OxyBURST Green H2HFF BSA oxidation were calculated between 30 and 80 min after particle internalization. A, D, F, and G, error bars denote S.E. of four independent experiments. *, p < 0.05.
FIGURE 2.
FIGURE 2.
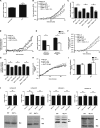
GILT−/− BMMØs display lower rates of phagosomal proteolysis in the absence of NOX2 activity. BMMØs derived from WT and GILT−/− mice were incubated for 18 h in the presence/absence of IFNγ. 10 min before addition and subsequent phagocytosis of experimental particles, BMMØs were treated with the NOX2 inhibitor DPI (0.5 μm) where indicated. A, B, and C, bulk phagosomal proteolysis as measured by hydrolysis of DQ-albumin conjugated to IgG-opsonized experimental particles in unactivated/IFNγ-activated BMMØs in the presence/absence of DPI. D, E, and F, bulk phagosomal proteolysis as measured by hydrolysis of DQ-albumin conjugated to mannosylated experimental particles in unactivated/IFNγ-activated BMMØs in the presence/absence of DPI. A, B, D, and E, representative real-time traces. Relative fluorescence units (RFU) values are proportional to the degree of substrate hydrolysis. C and F, averaged rates relative to unactivated/untreated WT controls from four independent experiments. Relative rates were calculated between 40 and 60 min after particle internalization. G, relative abundance of the lysosomal proteases in whole cell lysates of WT and GILT−/− BMMØs as detected by semiquantitative Western blotting. Mature forms of cathepsins B, S, L, and D and the pro-forms for cathepsins S, L, and D are shown. Representative images and average of band relative density from 4–6 independent experiments are shown. Each calculated pixel volume was normalized to the calculated pixel volume of GAPDH expression from the same sample. Relative density was determined by calculation of normalized pixel volume relative to WT sample using Quantity One analysis software. ns, not significant. Error bars denote S.E. *, p < 0.05. H, phagosomal oxidation of the OxyBURST Green H2HFF BSA substrate conjugated to IgG-opsonized experimental particles in unactivated, IL-4-activated (40 h), and IFNγ-activated (40 h) WT BMMØs. Averaged rates relative to unactivated control are shown. I, relative extracellular H2O2 production in unactivated, IL-4-activated (40 h), and IFNγ-activated (40 h) WT BMMØs after phagocytosis of serum-opsonized zymosan particles as measured by oxidation of the Amplex UltraRed reagent. Error bars denote S.E. *, p < 0.05.
FIGURE 3.
FIGURE 3.
GILT−/− BMMØs display significantly lower rates of phagosomal proteolysis after IL-4-activation. BMMØs derived from WT, GILT−/−, Cybb−/−, and GILT−/−/Cybb−/− mice were incubated for 40 h in the presence 10 ng/ml IL-4. 10 min before the addition and subsequent phagocytosis of experimental particles, BMMØs were treated with the NOX2 inhibitor DPI (0.5 μm) where indicated. A, total mRNA levels of GILT in unactivated and IL-4-activated BMMØs were determined by QPCR. Averaged relative mRNA levels from four independent QPCR experiments are shown. Relative expression was expressed as mRNA levels relative to 18 S and presented relative to unactivated BMMØs. Error bars denote S.E. *, p < 0.05. RFU, relative fluorescence units. B and C, bulk proteolysis as measured by hydrolysis of the DQ-albumin substrate conjugated to experimental particles in IL-4-activated BMMØs (four independent experiments). D and E, bulk proteolysis as measured by hydrolysis of the prereduced and alkylated DQ-albumin substrate (four independent experiments). Reduced DQ-albumin was prepared by incubating experimental particles in 1 mm dithiothreitol followed by alkylation with 2 mm iodoacetic acid. F and G, phagosomal hydrolysis of the cysteine cathepsin-specific substrate (biotin-LC-Phe-Arg)2-rhodamine 110 conjugated to experimental particles in IL-4-activated BMMØs (seven independent experiments). H, and I, phagosomal hydrolysis of the aspartic cathepsin specific substrate in IL-4-activated BMMØs (four independent experiments). B, D, F, and H, representative real-time traces. Relative fluorescence values are proportional to the degree of substrate hydrolysis. C, E, G, and I, averaged rates relative to unactivated/untreated WT controls. Relative rates were calculated between 40–60 min after particle internalization. Error bars denote S.E. *, p < 0.05 as determined by paired t test of the indicated experimental groups. J, relative abundance of the lysosomal proteases in whole cell lysates of WT and GILT−/− IL-4-activated BMMØs as detected by semi-quantitative Western blotting. Mature (Mat) forms of cathepsins B, S, L, and D and the pro-forms (Pro) for cathepsins S, L, and D are shown. Representative images and averages of band relative density from four (cathepsins B and D), six (cathepsin S), and seven (cathepsin L) independent experiments are shown. Each calculated pixel volume was normalized to the calculated pixel volume of GAPDH expression from the same sample. Relative density was determined by calculation of normalized pixel volume relative to WT sample using Quantity One analysis software. Error bars denote S.E. ns, not significant.
FIGURE 4.
FIGURE 4.
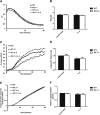
Phagosomal maturation is not altered in the absence of GILT. BMMØs derived from WT and GILT−/− mice were incubated for 40 h in the presence/absence of 10 ng/ml IL-4. A, phagosomal pH calculated from excitation ratios of the pH-sensitive carboxyfluorescein-SE conjugated to experimental particles by regression to a standard curve. B, average final pH as measured 60 min post experimental particle internalization over 3 independent experiments. C and D, PL fusion as measured by FRET between phagocytosed Alexa Fluor 488-conjugated experimental particles and Alexa Fluor 594 hydrazide-pulsed lysosomes. E and F, phagosomal hydrolysis of a fluorogenic β-galactosidase substrate relative to a calibration fluor. A, C, and E, representative real-time traces. Relative fluorescence units (RFU) values are proportional to the degree of phagosome/lysosome fusion/β-galactosidase substrate hydrolysis. D and F, averaged rates relative to unactivated/untreated WT controls from three independent experiments. Relative rates were calculated between 40 and 60 min after particle internalization. Error bars denote S.E.
FIGURE 5.
FIGURE 5.
Assessing the use of DPI and proteolytic substrates in IL-4-activated BMMØs. BMMØs derived from WT mice were incubated for 40 h in the presence/absence of 10 ng/ml IL-4. 10 min before the addition and subsequent phagocytosis of experimental particles, BMMØs were treated with the NOX2 inhibitor DPI (0.5 μm). A, phagosomal pH calculated from excitation ratios of the pH-sensitive carboxyfluorescein-SE conjugated to mannosylated experimental particles by regression to a standard curve. B, average final pH as measured 60 min post experimental particle internalization over four independent experiments. C and D, phagosomal hydrolysis of a fluorogenic β-galactosidase substrate relative to a calibration fluor. RFU, relative fluorescence units. E and F, bulk proteolysis as measured by hydrolysis of the DQ-albumin substrate conjugated to mannosylated experimental particles in IL-4-activated BMMØs in the presence/absence of DPI. G and H, phagosomal hydrolysis of the cysteine cathepsin-specific substrate (biotin-LC-Phe-Arg)2-rhodamine 110 conjugated to mannosylated experimental particles in IL-4-activated BMMØs in the presence/absence of DPI. A, C, E, and G, representative real-time traces. Relative fluorescence values are proportional to the degree of substrate hydrolysis. D, F, and H, averaged rates relative to untreated WT controls from three independent experiments. Relative rates were calculated between 40–60 min after particle internalization. Error bars denote S.E. *, p < 0.05.
FIGURE 6.
FIGURE 6.
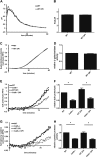
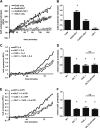
GILT maintains cathepsin S activity in a reconstituted system and in the early phagosome of IL-4-activated BMMØs. A and B, purified cathepsin S (CatS) activity on the cathepsin S-specific substrate Ac-KQKLR-AMC in the presence/absence of rGILT in a reconstituted system. Where indicated, heat inactivation (HI) of rGILT was performed by subjecting the enzyme to 95 °C for 10 min before addition. *, p < 0.05 compared with CatS alone and CatS/HI rGILT samples. A, representative real-time traces. RFU, relative fluorescence units. B, averaged rates relative to CatS only controls from four independent experiments. Relative rates were calculated between 90 and 150 min. Error bars denote S.E. C and D, bulk phagosomal proteolysis as measured by hydrolysis of the DQ-albumin substrate conjugated to experimental particles in IL-4-activated BMMØs derived from WT, GILT−/−, CatS−/−, and GILT−/−/CatS−/− mice. E and F, bulk proteolysis as measured by hydrolysis of the DQ-albumin substrate conjugated to experimental particles in IL-4-activated BMMØs treated with the NOX2 inhibitor DPI (0.5 μm) 10 min before the addition and subsequent phagocytosis of experimental particles. C, and E, representative real-time traces. Relative fluorescence units values are proportional to the degree of substrate hydrolysis. D, and F, averaged rates relative to unactivated/untreated WT controls from five independent experiments. Relative rates were calculated between 40 and 60 min after particle internalization. Error bars denote S.E. *, p < 0.05 compared with WT control. ns, not significant.

Similar articles

Cited by

References

    1. Huynh K. K., Grinstein S. (2007) Regulation of vacuolar pH and its modulation by some microbial species. Microbiol. Mol. Biol. Rev. 71, 452–462 - PMC - PubMed
    1. Nunes P., Demaurex N., Dinauer M. C. (2013) Regulation of the NADPH oxidase and associated ion fluxes during phagocytosis. Traffic 14, 1118–1131 - PubMed
    1. Flannagan R. S., Cosío G., Grinstein S. (2009) Antimicrobial mechanisms of phagocytes and bacterial evasion strategies. Nat. Rev. Microbiol. 7, 355–366 - PubMed
    1. Claus V., Jahraus A., Tjelle T., Berg T., Kirschke H., Faulstich H., Griffiths G. (1998) Lysosomal enzyme trafficking between phagosomes, endosomes, and lysosomes in J774 macrophages. Enrichment of cathepsin H in early endosomes. J. Biol. Chem. 273, 9842–9851 - PubMed
    1. Kotsias F., Hoffmann E., Amigorena S., Savina A. (2013) Reactive oxygen species production in the phagosome: impact on antigen presentation in dendritic cells. Antioxid. Redox Signal. 18, 714–729 - PubMed

Publication types

MeSH terms