. 2014 Dec 1;307(11):C1017-30.
doi: 10.1152/ajpcell.00332.2013. Epub 2014 Sep 24.

Functional mitochondrial analysis in acute brain sections from adult rats reveals mitochondrial dysfunction in a rat model of migraine

Affiliations

Functional mitochondrial analysis in acute brain sections from adult rats reveals mitochondrial dysfunction in a rat model of migraine

Nathan T Fried et al. Am J Physiol Cell Physiol. .

Abstract

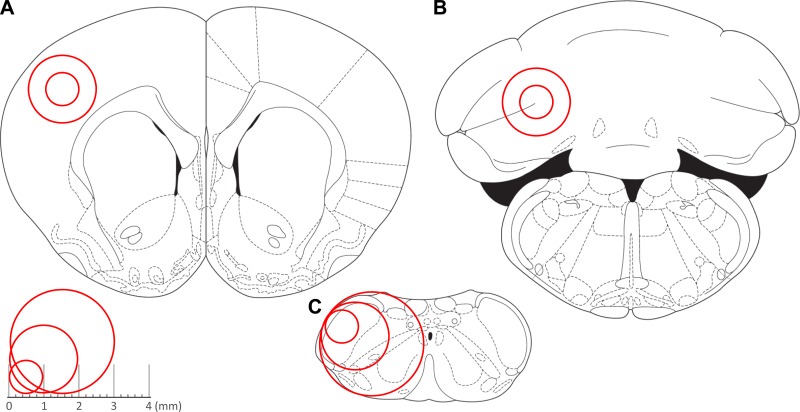
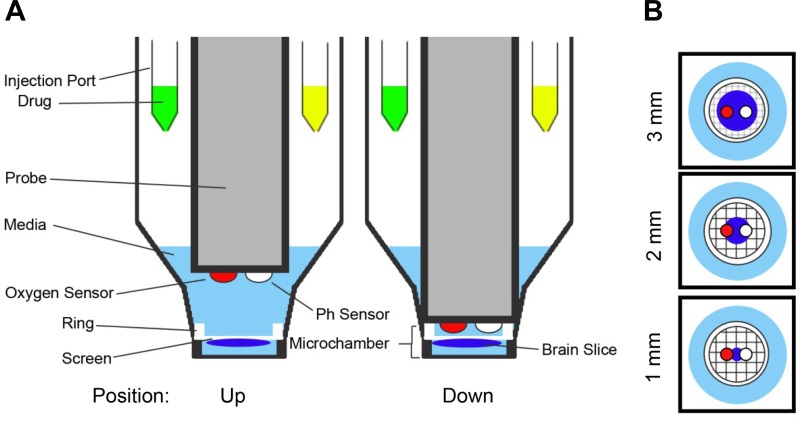
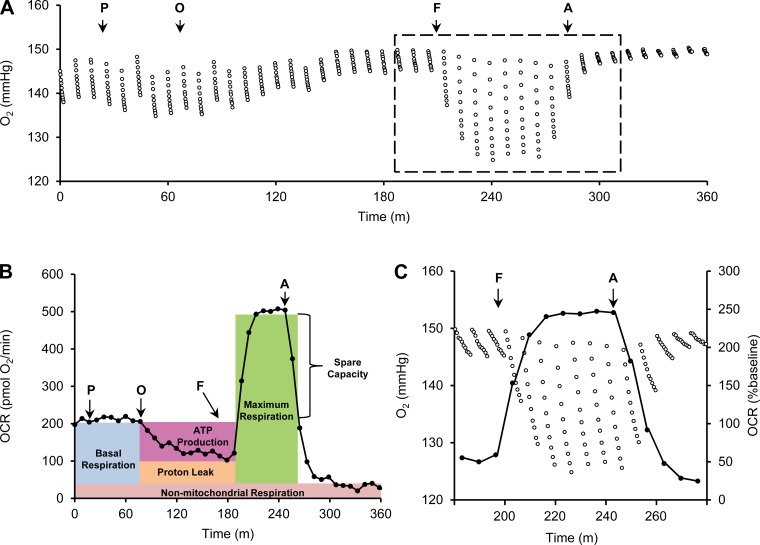
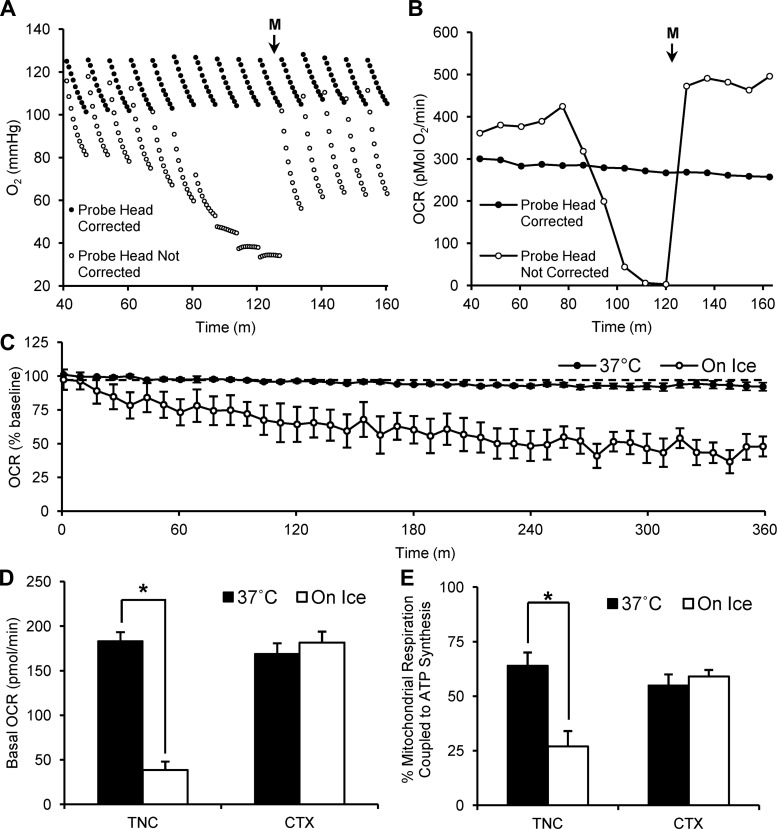
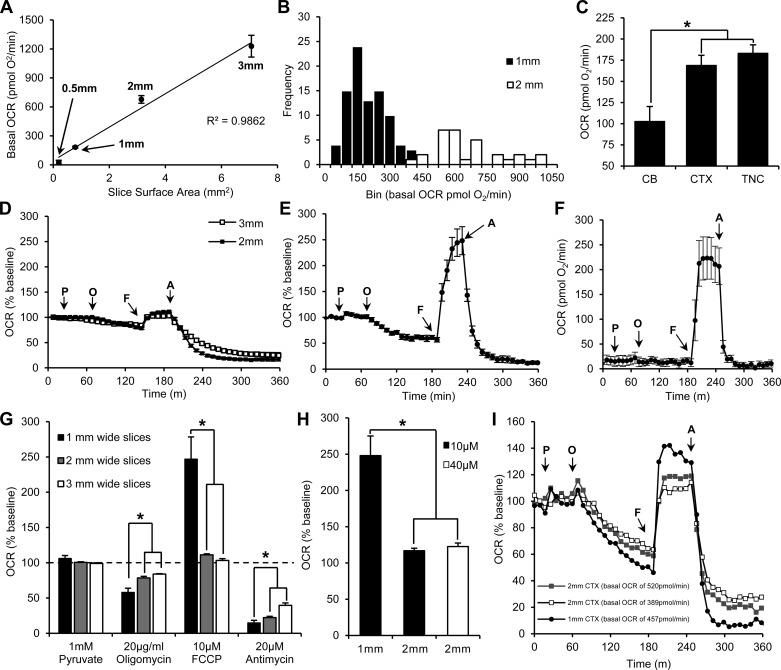
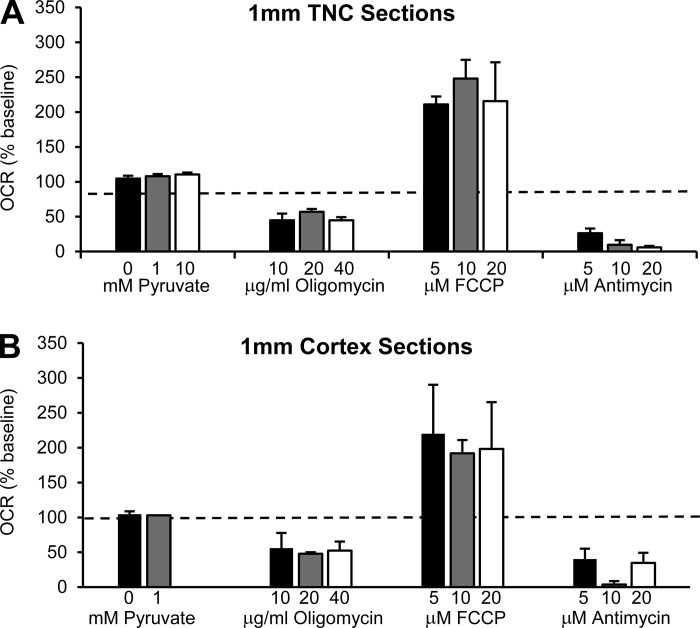
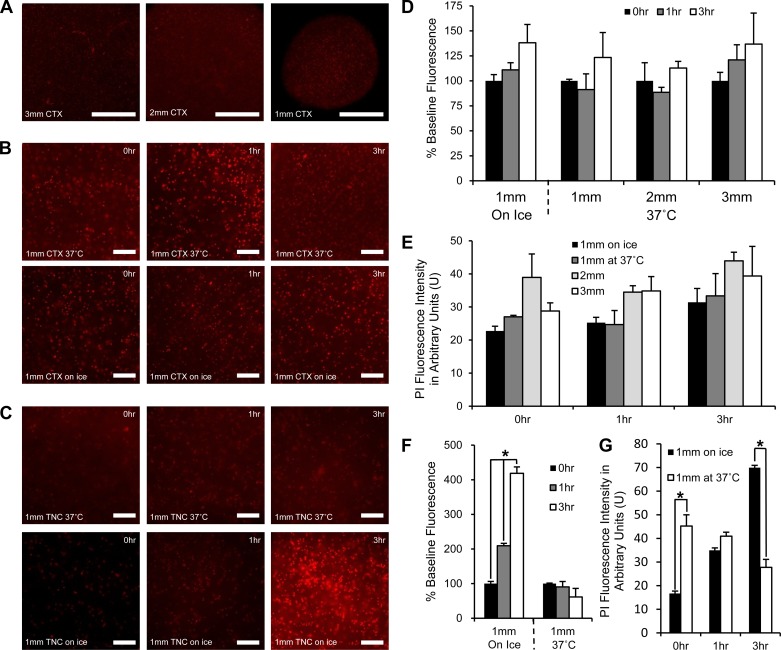
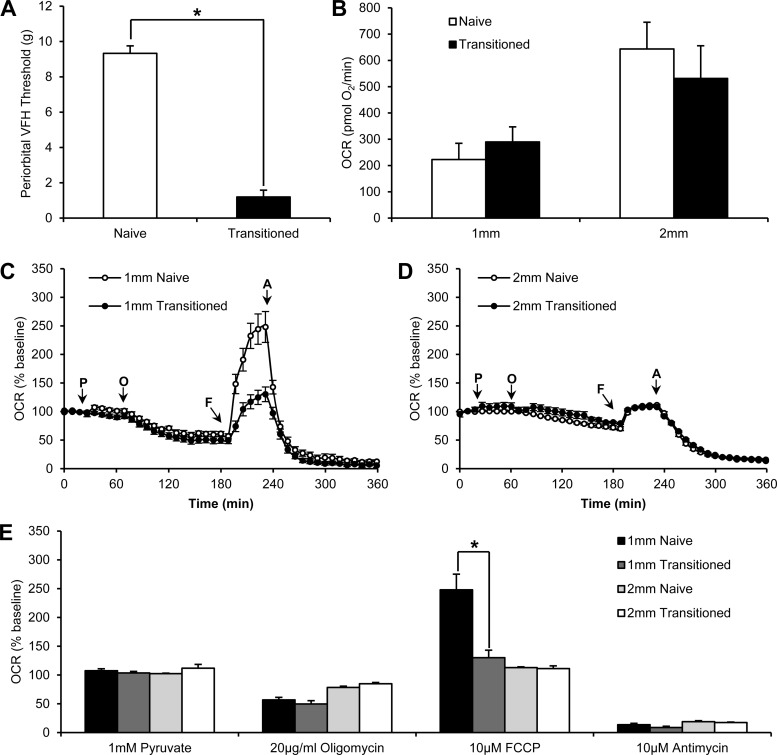
Mitochondrial dysfunction has been implicated in many neurological disorders that only develop or are much more severe in adults, yet no methodology exists that allows for medium-throughput functional mitochondrial analysis of brain sections from adult animals. We developed a technique for quantifying mitochondrial respiration in acutely isolated adult rat brain sections with the Seahorse XF Analyzer. Evaluating a range of conditions made quantifying mitochondrial function from acutely derived adult brain sections from the cortex, cerebellum, and trigeminal nucleus caudalis possible. Optimization of this technique demonstrated that the ideal section size was 1 mm wide. We found that sectioning brains at physiological temperatures was necessary for consistent metabolic analysis of trigeminal nucleus caudalis sections. Oxygen consumption in these sections was highly coupled to ATP synthesis, had robust spare respiratory capacities, and had limited nonmitochondrial respiration, all indicative of healthy tissue. We demonstrate the effectiveness of this technique by identifying a decreased spare respiratory capacity in the trigeminal nucleus caudalis of a rat model of chronic migraine, a neurological disorder that has been associated with mitochondrial dysfunction. This technique allows for 24 acutely isolated sections from multiple brain regions of a single adult rat to be analyzed simultaneously with four sequential drug treatments, greatly advancing the ability to study mitochondrial physiology in adult neurological disorders.

Keywords: adult brain sections; brain energy metabolism; mitochondria; neurological disorders; neuron-glial interactions.


Figures

Fig. 1.
Fig. 1.
Brain regions analyzed and punch sizes. Representative tissue punch sizes (1 mm, 2 mm, and 3 mm) for cortex (A), cerebellum (B), and trigeminal nucleus caudalis (TNC) (C). Red circles represent the areas that were obtained for analysis for each of the brain regions. [Adapted from Paxinos and Watson (41), with permission from Elsevier.]
Fig. 2.
Fig. 2.
Plate configuration. A: side-view schematic of 2 wells of the 24-well XF Islet Microplate. The probe head containing an oxygen and pH biosensor is shown in the up and down positions. When in the down position, a transient microchamber (1 mm deep × 3 mm diameter) is formed to allow for measurement of oxygen consumption rates (OCRs) of a brain section. B: top-view schematic of the 3 section sizes (1 mm, 2 mm, and 3 mm) in relation to the microchamber and the biosensors on the probe head.
Fig. 3.
Fig. 3.
OCRs from O2 readings of a single acute brain section. A: O2 readings from a single respiring 1-mm-wide, 250-μm-thick TNC section. 10 sequential O2 measurements are made after the probe head has lowered, forming the minimally oxygen-impermeable microchamber. O2 levels rise back to atmospheric levels after the probe head is lifted. This is then followed by another set of 10 O2 readings after the probe head lowers again. Injection of 1 mM pyruvate (P), 20 μg/ml oligomycin (O), 10 μM carbonyl cyanide 4-(trifluoromethoxy) phenylhydrazone (FCCP) (F), and 20 μM antimycin (A) are marked by arrows, modifying mitochondrial respiration, and leading to changes in the amount of oxygen consumed by the section. B: OCRs calculated from the individual O2 readings from A. Drug responses can be used to interpret basal mitochondrial respiration, ATP production, proton leak, max respiration, spare capacity, and nonmitochondrial respiration. C: this is an expanded version of the portion from A that is marked by the dashed lines. It shows the translation of the 10 O2 measurements (left y-axis) to the OCRs (right y-axis) for 3 OCR measurements before FCCP injection, 7 after FCCP injection, and 5 after antimycin injection.
Fig. 4.
Fig. 4.
Probe head adjustment and sectioning temperature essential for stability of acute sections. A: O2 readings of 2 TNC sections representing measurements from reads when the probe head height was corrected (lowered from 26,600 steps to 27,900 steps) and when the probe head height was not corrected. B: absolute OCRs derived from O2 readings from A. C: 6 h of OCR measurements from 250-μm-thick, 1-mm-wide TNC sections processed at 37°C (n = 7 sections) and on ice (n = 9 sections). D: basal OCR (pmol/min) of 250-μm-thick, 1-mm-wide TNC sections processed at 37°C (n = 81 sections) and on ice (n = 13 sections) compared with cortex (CTX) sections processed at 37°C (n = 47 sections) and on ice (n = 11 sections). E: percentage of mitochondrial respiration coupled to ATP synthesis (calculated from maximum response to 20 μg/ml oligomycin) of 250-μm-thick, 1-mm-wide TNC sections processed at 37°C (n = 12 sections) and on ice (n = 7 sections) compared with CTX processed at 37°C (n = 9 sections) and on ice (n = 8 sections). Media injection is represented by M; *P < 0.05.
Fig. 5.
Fig. 5.
Optimal section diameter for basal OCR and drug responses. A: basal OCRs vs. section surface area for 3-mm (n = 4 slice), 2-mm (n = 32 sections), 1-mm (n = 81 sections), and 0.5-mm (n = 7 sections) TNC sections are linearly correlated. B: histogram of basal OCR for 1-mm (n = 81 sections) and 2-mm (n = 32 sections) TNC sections (bin = 50 pmol/min). C: mean basal OCRs for 1-mm sections from cerebellum (CB) (n = 10 sections), CTX (n = 47 sections), and TNC (n = 81 sections). D: baseline-normalized OCRs from 3-mm TNC (n = 4 sections) and 2-mm TNC (n = 13 sections). E: baseline-normalized OCRs from 1-mm TNC sections (n = 12 sections). F: absolute OCRs from 0.5-mm TNC sections (n = 7 sections). G: quantification of drug effects (% baseline) for each section diameter from D and E. H: maximum respiration following addition of 10 μM FCCP in 1-mm (n = 12 sections) and 2-mm TNC sections (n = 5 sections) and 40 μM in 2-mm TNC sections (n = 5 sections). I: 3 separate sections from the CTX with similar starting basal OCRs. Injection of 1 mM pyruvate, 20 μg/ml oligomycin, 10 μM FCCP, and 20 μM antimycin are marked by arrows, *P < 0.05.
Fig. 6.
Fig. 6.
1-mm TNC and CTX section responses to various drug concentrations. A: pyruvate, oligomycin, FCCP, and antimycin drug response in TNC sections: 0 mM (n = 3 sections), 1 mM (n = 5 sections), and 10 mM (n = 5 sections) pyruvate; 10 μg/ml (n = 5 sections), 20 μg/ml (n = 5 sections), and 40 μg/ml (n = 5 sections) oligomycin; 5 μM (n = 4 sections), 10 μM (n = 5 sections), and 20 μM (n = 5 sections) FCCP; 5 μM (n = 4 sections), 10 μM (n = 5 sections), and 20 μM (n = 5 sections) antimycin. B: pyruvate, oligomycin, FCCP, and antimycin response in CTX sections: 0 mM (n = 5 sections) and 1 mM (n = 5 sections) pyruvate; 10 μg/ml (n = 6 sections), 20 μg/ml (n = 4 sections), and 40 μg/ml (n = 5 sections) oligomycin; 5 μM (n = 5 sections), 10 μM (n = 4 sections), and 20 μM (n = 5 sections) FCCP; 5 μM (n = 6 sections), 10 μM (n = 4 sections), and 20 μM (n = 3 sections) antimycin.
Fig. 7.
Fig. 7.
Propidium iodide (PI) fluorescence in CTX and TNC sections obtained at 37°C and on ice. A: representative images of PI staining of a 3-mm CTX, 2-mm CTX, and 1-mm CTX at 0 h (×4 magnification) (bar = 500 μm). B: representative images of PI staining of 1-mm CTX sections obtained at 37°C or on ice during 0-h, 1-h, and 3-h time points (×10 magnification) (bar = 10 μm). C: representative images of PI staining of 1-mm TNC sections obtained at 37°C or on ice during 0-h, 1-h, and 3-h time points (×10 magnification) (bar = 10 μm). D: PI fluorescence quantified as percent change from 0-h time point (baseline) for 1-mm, 2-mm, and 3-mm CTX sections over 3 h of incubation at 37°C following sectioning at 37°C or on ice. E: PI fluorescence intensity in arbitrary units (U) for comparison of section size and sectioning temperature on CTX sections sectioned at 37°C or on ice at 0-h, 1-h, and 3-h time points. F: PI fluorescence quantified as percent change from 0-h time point (baseline) for 1-mm TNC sections over 3 h of incubation at 37°C following sectioning at 37°C or on ice. G: PI fluorescence intensity in arbitrary units for comparison of sectioning temperature on TNC sections at 0-h, 1-h, and 3-h time points (n = 5 for sections obtained at 37°C and n = 6 for those obtained on ice). *P < 0.01.
Fig. 8.
Fig. 8.
Decreased spare respiratory capacity in 1-mm TNC sections from a rat model of chronic migraine. A: periorbital Von Frey (VFH) thresholds of naive and transitioned rats, rats that have received 12 inflammatory soup infusions onto their dura (n = 6 rats for naive and 6 rats for transitioned groups). B: basal OCRs of 1-mm TNC sections from naive rats (n = 12 sections), 2-mm TNC sections from naive rats (n = 13 sections), 1-mm TNC sections from transitioned rats (n = 11 sections), and 2-mm TNC sections from transitioned rats (n = 9 sections). C: baseline-normalized OCRs from 1-mm TNC sections from naive rats (n = 12 sections) and 1-mm TNC sections from transitioned rats (n = 11 sections). D: baseline-normalized OCRs from 2-mm TNC sections from naive rats (n = 13 sections) and 2-mm TNC sections from transitioned rats (n = 9 sections). E: quantification of drug effects (% baseline) from C and D. (*P < 0.01). Injections of 1 mM pyruvate, 20 μg/ml oligomycin, 10 μM FCCP, and 20 μM antimycin are marked by arrows (*P < 0.05).

Similar articles

Cited by

References

    1. Abend NS, Mani R, Tschuda TN, Chang T, Topjian AA, Donnelly M, LaFalce D, Krauss MC, Schmitt SE, Levine JM. EEG monitoring during therapeutic hypothermia in neonates, children, and adults. Am J Electroneurodiagnostic Technol 51: 141–164, 2011. - PMC - PubMed
    1. Allaman I, Bélanger M, Magistretti PJ. Astrocyte-neuron metabolic relationships: For better and for worse. Trends Neurosci 34: 76–87, 2011. - PubMed
    1. Bernstein C, Burstein R. Sensitization of the trigeminovascular pathway: Perspective and implications to migraine pathophysiology. J Clin Neurol 8: 89–99, 2012. - PMC - PubMed
    1. Blättler SM, Verdeguer F, Liesa M, Cunningham JT, Vogel RO, Chim H, Liu H, Romanino K, Shirihai OS, Vazquez F, Rüegg MA, Shi Y, Puigserver P. Defective mitochondrial morphology and bioenergetic function in mice lacking the transcription factor Yin Yang 1 in skeletal muscle. Mol Cell Biol 32: 3333–3346, 2012. - PMC - PubMed
    1. Bogousslavsky J, Meienberg O. EYe-movement disorders in brain-stem and cerebellar stroke. Arch Neurol 44: 141–148, 1987. - PubMed

Publication types

LinkOut - more resources