Comparative Study
. 2014 Sep 23;9(9):e108495.
doi: 10.1371/journal.pone.0108495. eCollection 2014.

PTEN redundancy: overexpressing lpten, a homolog of Dictyostelium discoideum ptenA, the ortholog of human PTEN, rescues all behavioral defects of the mutant ptenA-

Affiliations
Comparative Study

PTEN redundancy: overexpressing lpten, a homolog of Dictyostelium discoideum ptenA, the ortholog of human PTEN, rescues all behavioral defects of the mutant ptenA-

Daniel F Lusche et al. PLoS One. .

Abstract

Mutations in the tumor suppressor gene PTEN are associated with a significant proportion of human cancers. Because the human genome also contains several homologs of PTEN, we considered the hypothesis that if a homolog, functionally redundant with PTEN, can be overexpressed, it may rescue the defects of a PTEN mutant. We have performed an initial test of this hypothesis in the model system Dictyostelium discoideum, which contains an ortholog of human PTEN, ptenA. Deletion of ptenA results in defects in motility, chemotaxis, aggregation and multicellular morphogenesis. D. discoideum also contains lpten, a newly discovered homolog of ptenA. Overexpressing lpten completely rescues all developmental and behavioral defects of the D. discoideum mutant ptenA-. This hypothesis must now be tested in human cells.


Conflict of interest statement

Competing Interests: The authors have declared that no competing interests exist.

Figures

Figure 1
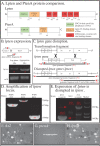
Figure 1. Lpten is a homolog of ptenA and an ortholog of human PTEN.
lpten was disrupted to produce the lpten null mutant lpten. A. A comparison of Lpten and PtenA. The number of amino acids, the two conserved domains, CDC14 and PTEN-C2, and the LIM domains, are indicated. B. RT-PCR revealed that lpten is up-regulated during aggregation. lpten expression during development was assessed by RT-PCR and quantified by densitometry. lpten expression was up-regulated more than 10 fold. P1and P2 (see Table S1) demark the positions of the primers used to amplify the 300bp lpten cDNA fragment (F). RT-PCR of the large subunit ribosomal RNA, rnlA, was assessed for comparability of gel loading. C. Scheme for lpten disruption. The positions of primers P3 to P7 (see Table S1) are demarcated for amplification of lpten in control Ax2 and lpten cells, to generate the undisrupted lpten genomic fragment F1, the disrupted lpten genomic fragment of lpten, F2 genomic fragment F2, and a partial lpten genomic fragment with a partial bsr cassette, F3. D. Verification of lpten disruption by PCR. See panel C for the positions of the primers to generate fragments F1, F2 and F3. E. Verification that the lpten transcript is missing in the lpten mutant using RT-PCR with the primers LptenFW and PtencDNArv for ptenA, and PtenAcDNAFW and ptencDNArv to demonstrate the presence of ptenA in lpten. See Table S1 for description of primers. F. The completion of multicellular morphogenesis by the formation of fruiting bodies in control Ax2 cells. G. The absence of morphogenesis by ptenA cells. H. The completion of multicellular morphogenesis by lpten cells.
Figure 2
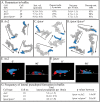
Figure 2. lpten cells translocating in buffer in the absence of chemoattractant exhibit defects in velocity, turning and the suppression of lateral pseudopod formation.
Cells were analyzed in a perfusion chamber through which buffer without attractant was pumped. A. 2D motility parameters of Ax2, lpten and ptenA/lptenoe cells assessed with 2D-DIAS software. B, C, D. 2D-DIAS reconstructions of cell perimeters to generate tracks. Arrows denote net direction, and the blue-filled perimeters represent the last cell positions in the tracks. E, F. 3D-DIAS reconstructions at 0° (top view) and 90° (side view) of representative Ax2 and lpten cells, respectively, denoting pseudopods (red). Note that the multiple lateral pseudopods formed by lpten cells, were primarily off the substrate. a, anterior end of cell; p, posterior end of cell; lps, lateral pseudopod. G. 2D analysis of lateral pseudopod formation. Inst. vel., instantaneous velocity; No. turns per 10 min., number of turns per 10 minutes; Percent mot. cells, percent motile cells. Parameters are presented as the means ± standard deviations. T-test was used to determine p values. Parameters are defined in Table S2.
Figure 3
Figure 3. lpten cells undergo normal chemotaxis in the low cAMP concentration gradient generated in the estimated for that of the natural wave.
The gradient was generated in BSS buffer, in which K+ and Na+ are the facilitating cations. lpten cells, however, are still defective in suppressing lateral pseudopod formation. A. 2D motility and chemotaxis parameters, assessed by 2D-DIAS software of Ax2, lpten and lpten/lptenoe cells undergoing chemotaxis in a low cAMP concnetration gradient. B, C, D. 2D-DIAS-reconstructed perimeter tracks of representative cells. The large arrows at panel bottoms denote the net direction of the increasing cAMP gradient. “Sink”, trough with buffer alone; “Source”, trough with buffer plus 1 µM cAMP. E. 2D analysis of lateral pseudopod formation. Direct. Persist, directional persistence; chem. index, Chemotactic Index (CI); Percent pos. chem., percent cells with a positive CI. See legend to Figure 2 for additional definitions and details. Parameters are defined in Table S2.
Figure 4
Figure 4. Overexpressing lpten in the ptenA mutant.
A. The transformation vector used to generate strains ptenA/lptenoe, in which lpten is under the regulation of the actin 15 (act15) promoter, fused in frame at the 3′ end to the red fluorescent protein gene (rfp) and terminating with a 3′ actin 8 gene sequence. The positions of the primers P8 and P9, for generating the lpten-rfp cDNA, are denoted. Insert shows verification of the lpten-rfp cDNA by PCR. B. lpten is expressed in ptenA/lptenoe cells at levels more than 10 times that in the parent ptenA mutant. The positions of the primers (P1, P2) for RT-PCR of the 300 bp lpten fragment (F) are denoted. In the insert to the right of panel B, RT-PCR products of chemotactically responsive ptenA and ptenA/lptenoe cells reveals overexpression of lpten in the latter. Densitometry measurements revealed>10 fold overexpression. C. Fruiting body formation in Ax2 cultures. D. The absence of fruiting body formation in ptenA cultures. E. Fruiting body formation in ptenA/lptenoe cultures. See Table S1 for description of primers.
Figure 5
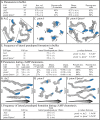
Figure 5. Overexpression of lpten rescues the basic behavioral defects of ptenA cells that are translocating in buffer, and both the behavioral and chemotactic defects in a cAMP gradient generated in the concentration range of the natural wave.
A. 2D motility parameters of cells translocating in buffer, assessed by 2D-DIAS software. B, C, D. 2D-DIAS reconstructions of perimeter tracks of Ax2, ptenA and ptenA/lptenoe cells, respectively, translocating in buffer. E. 2D analysis of lateral pseudopod formation in buffer. F. 2D motility and chemotaxis parameters assessed by 2D-DIAS software during chemotaxis in a low cAMP concentration gradient. G, H, I. Perimeter tracks of cells in a low cAMP concentration gradient. J. 2D analysis of lateral pseudopod formation during chemotaxis in a low cAMP concentration gradient. See the legend to Figure 2 for explanations of panels A through E, and the legend to Figure 2 and 3 for explanations of panels F through J.
Figure 6
Figure 6. Overexpression of lpten rescues the behavioral defects exhibited by homogeneous populations of ptenA cells undergoing chemotaxis in natural aggregation territories in submerged cultures on glass.
A, B, C. The centroid tracks of four neighboring cells representative of the general behavior of Ax2, ptenA and ptenA/lptenoe populations, respectively, are presented in relation to the aggregation centers of Ax2 and ptenA/lptenoe cells, and the interpreted aggregation center of ptenA, deduced retrospectively by the direction of net translocation of groups of cells, in the upper half of each panel. The first (1) and last (150) centered in the centroid tracks are noted. In lower half of each panel, the velocity plots are presented for two respective cells. For normal cells, the peaks of velocity have been shown to correlate with the front of each relayed natural wave.
Figure 7
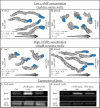
Figure 7. ptenA cells pulsed in suspension with cAMP to induce chemotactic competence are defective in assessing the direction of a low cAMP concentration gradient in the range of a natural wave, but they can efficiently assess the direction of a cAMP gradient in a concentration range 10 times higher.
Pulsing ptenA cells with cAMP also up-regulates lpten. A, B. 2D-DIAS reconstructions of perimeter tracks of Ax2 and ptenA cells, respectively, in a low cAMP concentration gradient, generated by adding 1 µM cAMP to the source well of the gradient chamber. Motility and chemotaxis parameters assessed by 2D-DIAS software are presented in the lower left hand corner of each panel. C, D. Perimeter tracks of representative Ax2 and ptenA cells, respectively, in a high cAMP concentration gradient, generated by adding 10 µM cAMP to the source well of the gradient chamber. Motility and chemotaxis parameters are displayed in the lower left corner of each panel. E, F. Up-regulation of lpten expression in cAMP pulsed Ax2 and ptenA cells, respectively. In each strain, cells were analyzed by RT-PCR using primers P1 and P2 (Table S1), prior to cAMP pulsing (1 hr), after cAMP pulsing for six hours (6 hr) and after cAMP pulsing with buffer for six hours (6 h). The constitutively expressed large subunit ribosomal RNA (rnlA) was assessed for comparability (see Figure 1 and 4). No RT, no reverse transcriptase added; IV, instantaneous velocity; CI, chemotactic index; %+, percent cells with a positive CI; N, number of cells assessed. Parameters in panels A, B, C and D are defined in Table S2.

Similar articles

Cited by

References

    1. Hollander MC, Blumenthal GM, Dennis PA (2011) PTEN loss in the continuum of common cancers, rare syndromes and mouse models. Nat Rev Cancer 11: 289–301. - PMC - PubMed
    1. Li J, Yen C, Liaw D, Podsypanina K, Bose S, et al. (1997) PTEN, a putative protein tyrosine phosphatase gene mutated in human brain, breast, and prostate cancer. Science 275: 1943–1947. - PubMed
    1. Steck PA, Pershouse MA, Jasser SA, Yung WK, Lin H, et al. (1997) Identification of a candidate tumour suppressor gene, MMAC1, at chromosome 10q23.3 that is mutated in multiple advanced cancers. Nat Genet 15: 356–362. - PubMed
    1. Vitolo MI, Weiss MB, Szmacinski M, Tahir K, Waldman T, et al. (2009) Deletion of PTEN promotes tumorigenic signaling, resistance to anoikis, and altered response to chemotherapeutic agents in human mammary epithelial cells. Cancer Res 69: 8275–8283. - PMC - PubMed
    1. Tamura M, Gu J, Matsumoto K, Aota S, Parsons R, et al. (1998) Inhibition of cell migration, spreading, and focal adhesions by tumor suppressor PTEN. Science 280: 1614–1617. - PubMed

Publication types

Associated data

Grants and funding

This work was supported by the Monoclonal Antibody Research Institute and the Developmental Studies Hybridoma Bank, the latter a National Resource created by the National Institutes of Health (NIH) and housed at the University of Iowa. The funders had no role in study design, data collection and analysis, decision to publish, or preparation of the manuscript.

LinkOut - more resources