Power analysis and sample size estimation for RNA-Seq differential expression
- PMID: 25246651
- PMCID: PMC4201821
- DOI: 10.1261/rna.046011.114
Power analysis and sample size estimation for RNA-Seq differential expression
Abstract
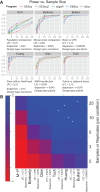
It is crucial for researchers to optimize RNA-seq experimental designs for differential expression detection. Currently, the field lacks general methods to estimate power and sample size for RNA-Seq in complex experimental designs, under the assumption of the negative binomial distribution. We simulate RNA-Seq count data based on parameters estimated from six widely different public data sets (including cell line comparison, tissue comparison, and cancer data sets) and calculate the statistical power in paired and unpaired sample experiments. We comprehensively compare five differential expression analysis packages (DESeq, edgeR, DESeq2, sSeq, and EBSeq) and evaluate their performance by power, receiver operator characteristic (ROC) curves, and other metrics including areas under the curve (AUC), Matthews correlation coefficient (MCC), and F-measures. DESeq2 and edgeR tend to give the best performance in general. Increasing sample size or sequencing depth increases power; however, increasing sample size is more potent than sequencing depth to increase power, especially when the sequencing depth reaches 20 million reads. Long intergenic noncoding RNAs (lincRNA) yields lower power relative to the protein coding mRNAs, given their lower expression level in the same RNA-Seq experiment. On the other hand, paired-sample RNA-Seq significantly enhances the statistical power, confirming the importance of considering the multifactor experimental design. Finally, a local optimal power is achievable for a given budget constraint, and the dominant contributing factor is sample size rather than the sequencing depth. In conclusion, we provide a power analysis tool (http://www2.hawaii.edu/~lgarmire/RNASeqPowerCalculator.htm) that captures the dispersion in the data and can serve as a practical reference under the budget constraint of RNA-Seq experiments.
Keywords: RNA-Seq; bioinformatics; power analysis; sample size; simulation.
© 2014 Ching et al.; Published by Cold Spring Harbor Laboratory Press for the RNA Society.
Figures


Similar articles
-
An evaluation of RNA-seq differential analysis methods.PLoS One. 2022 Sep 16;17(9):e0264246. doi: 10.1371/journal.pone.0264246. eCollection 2022. PLoS One. 2022. PMID: 36112652 Free PMC article.
-
A comparison of per sample global scaling and per gene normalization methods for differential expression analysis of RNA-seq data.PLoS One. 2017 May 1;12(5):e0176185. doi: 10.1371/journal.pone.0176185. eCollection 2017. PLoS One. 2017. PMID: 28459823 Free PMC article.
-
Benchmarking differential expression analysis tools for RNA-Seq: normalization-based vs. log-ratio transformation-based methods.BMC Bioinformatics. 2018 Jul 18;19(1):274. doi: 10.1186/s12859-018-2261-8. BMC Bioinformatics. 2018. PMID: 30021534 Free PMC article.
-
Differential Expression Analysis of RNA-seq Reads: Overview, Taxonomy, and Tools.IEEE/ACM Trans Comput Biol Bioinform. 2020 Mar-Apr;17(2):566-586. doi: 10.1109/TCBB.2018.2873010. Epub 2018 Oct 1. IEEE/ACM Trans Comput Biol Bioinform. 2020. PMID: 30281477 Review.
-
The power and promise of RNA-seq in ecology and evolution.Mol Ecol. 2016 Mar;25(6):1224-41. doi: 10.1111/mec.13526. Epub 2016 Mar 1. Mol Ecol. 2016. PMID: 26756714 Review.
Cited by
-
Unraveling the molecular heterogeneity in type 2 diabetes: a potential subtype discovery followed by metabolic modeling.BMC Med Genomics. 2020 Aug 24;13(1):119. doi: 10.1186/s12920-020-00767-0. BMC Med Genomics. 2020. PMID: 32831068 Free PMC article.
-
Interferon-β corrects massive gene dysregulation in multiple sclerosis: Short-term and long-term effects on immune regulation and neuroprotection.EBioMedicine. 2019 Nov;49:269-283. doi: 10.1016/j.ebiom.2019.09.059. Epub 2019 Oct 21. EBioMedicine. 2019. PMID: 31648992 Free PMC article.
-
Linking environmental risk factors with epigenetic mechanisms in Parkinson's disease.NPJ Parkinsons Dis. 2023 Aug 25;9(1):123. doi: 10.1038/s41531-023-00568-z. NPJ Parkinsons Dis. 2023. PMID: 37626097 Free PMC article. Review.
-
Power and sample size calculations for high-throughput sequencing-based experiments.Brief Bioinform. 2018 Nov 27;19(6):1247-1255. doi: 10.1093/bib/bbx061. Brief Bioinform. 2018. PMID: 28605403 Free PMC article.
-
Sample size calculation while controlling false discovery rate for differential expression analysis with RNA-sequencing experiments.BMC Bioinformatics. 2016 Mar 31;17:146. doi: 10.1186/s12859-016-0994-9. BMC Bioinformatics. 2016. PMID: 27029470 Free PMC article.
References
Publication types
MeSH terms
Substances
Grants and funding
LinkOut - more resources
Full Text Sources
Other Literature Sources
