Stereological study of the neuronal number and volume of 38 brain subdivisions of subjects diagnosed with autism reveals significant alterations restricted to the striatum, amygdala and cerebellum
- PMID: 25231243
- PMCID: PMC4177256
- DOI: 10.1186/s40478-014-0141-7
Stereological study of the neuronal number and volume of 38 brain subdivisions of subjects diagnosed with autism reveals significant alterations restricted to the striatum, amygdala and cerebellum
Abstract
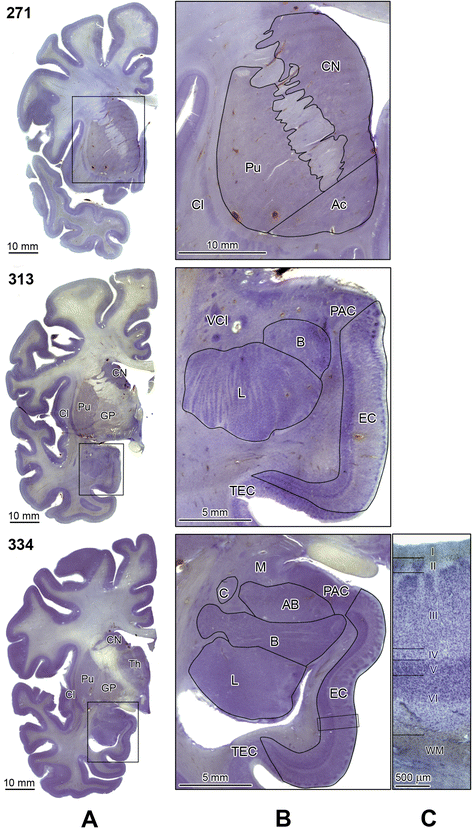
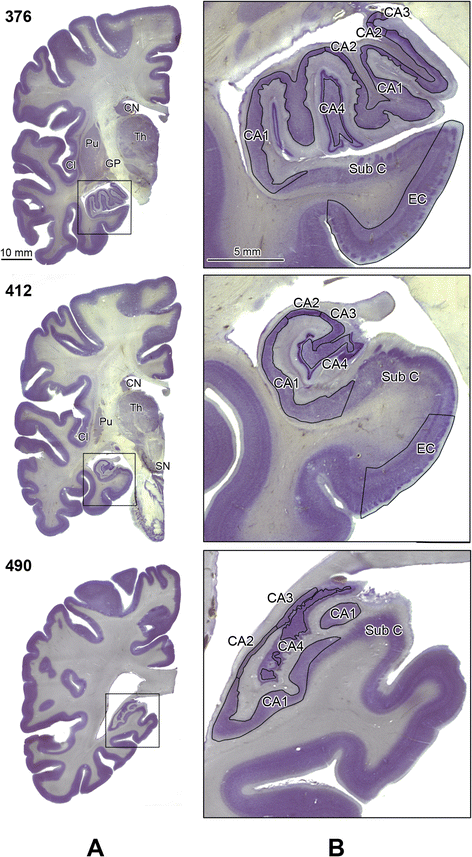
Introduction: A total of 38 brain cytoarchitectonic subdivisions, representing subcortical and cortical structures, cerebellum, and brainstem, were examined in 4- to 60-year-old subjects diagnosed with autism and control subjects (a) to detect a global pattern of developmental abnormalities and (b) to establish whether the function of developmentally modified structures matches the behavioral alterations that are diagnostic for autism. The volume of cytoarchitectonic subdivisions, neuronal numerical density, and total number of neurons per region of interest were determined in 14 subjects with autism and 14 age-matched controls by using unbiased stereological methods.
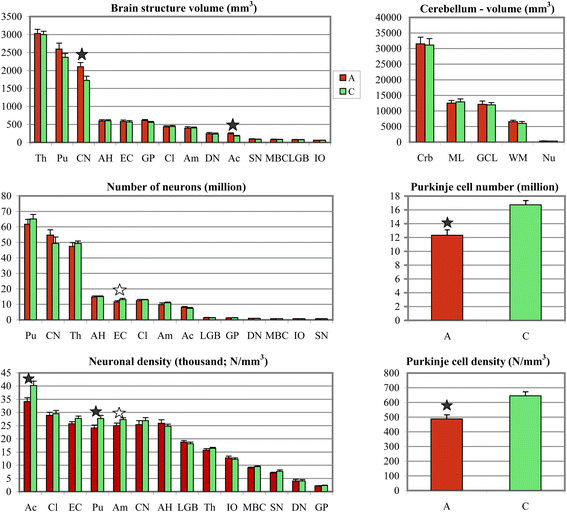
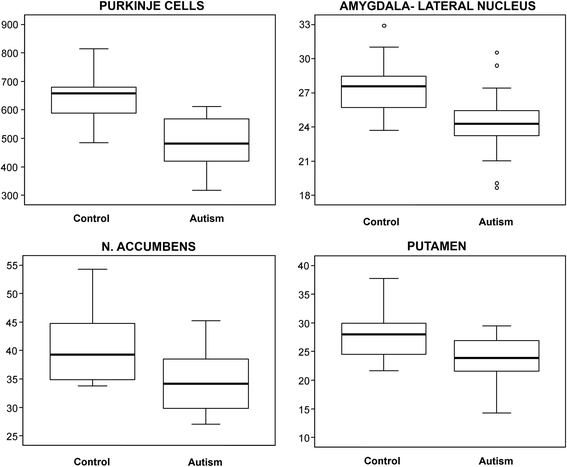
Results: The study revealed that significant differences between the group of subjects with autism and control groups are limited to a few brain regions, including the cerebellum and some striatum and amygdala subdivisions. In the group of individuals with autism, the total number and numerical density of Purkinje cells in the cerebellum were reduced by 25% and 24%, respectively. In the amygdala, significant reduction of neuronal density was limited to the lateral nucleus (by 12%). Another sign of the topographic selectivity of developmental alterations in the brain of individuals with autism was an increase in the volumes of the caudate nucleus and nucleus accumbens by 22% and 34%, respectively, and the reduced numerical density of neurons in the nucleus accumbens and putamen by 15% and 13%, respectively.
Conclusions: The observed pattern of developmental alterations in the cerebellum, amygdala and striatum is consistent with the results of magnetic resonance imaging studies and their clinical correlations, and of some morphometric studies that indicate that detected abnormalities may contribute to the social and communication deficits, and repetitive and stereotypical behaviors observed in individuals with autism.
Figures


Similar articles
-
Neuronal nucleus and cytoplasm volume deficit in children with autism and volume increase in adolescents and adults.Acta Neuropathol Commun. 2015 Jan 17;3:2. doi: 10.1186/s40478-015-0183-5. Acta Neuropathol Commun. 2015. PMID: 25595448 Free PMC article.
-
Stereological analysis of amygdala neuron number in autism.J Neurosci. 2006 Jul 19;26(29):7674-9. doi: 10.1523/JNEUROSCI.1285-06.2006. J Neurosci. 2006. PMID: 16855095 Free PMC article.
-
Significant neuronal soma volume deficit in the limbic system in subjects with 15q11.2-q13 duplications.Acta Neuropathol Commun. 2015 Oct 13;3:63. doi: 10.1186/s40478-015-0241-z. Acta Neuropathol Commun. 2015. PMID: 26463344 Free PMC article.
-
Neuroanatomy of autism.Trends Neurosci. 2008 Mar;31(3):137-45. doi: 10.1016/j.tins.2007.12.005. Epub 2008 Feb 6. Trends Neurosci. 2008. PMID: 18258309 Review.
-
Structural neuroimaging in autism.Neuro Endocrinol Lett. 2008 Jun;29(3):281-6. Neuro Endocrinol Lett. 2008. PMID: 18580841 Review.
Cited by
-
Morphological Correlates of Behavioral Variation in Autism Spectrum Disorder Groups in A Maternal Immune Activation Model.Noro Psikiyatr Ars. 2024 Jun 11;67(3):195-201. doi: 10.29399/npa.28637. eCollection 2024. Noro Psikiyatr Ars. 2024. PMID: 39258126 Free PMC article.
-
A Role for the Claustrum in Salience Processing?Front Neuroanat. 2019 Jun 19;13:64. doi: 10.3389/fnana.2019.00064. eCollection 2019. Front Neuroanat. 2019. PMID: 31275119 Free PMC article.
-
The Semiology of Motor Disorders in Autism Spectrum Disorders as Highlighted from a Standardized Neuro-Psychomotor Assessment.Front Psychol. 2016 Sep 12;7:1292. doi: 10.3389/fpsyg.2016.01292. eCollection 2016. Front Psychol. 2016. PMID: 27672371 Free PMC article.
-
Aberrant Cerebellar-Cerebral Functional Connectivity in Children and Adolescents With Autism Spectrum Disorder.Front Hum Neurosci. 2018 Nov 13;12:454. doi: 10.3389/fnhum.2018.00454. eCollection 2018. Front Hum Neurosci. 2018. PMID: 30483084 Free PMC article.
-
Motor Functional Characteristics in Attention-Deficit/Hyperactivity Disorder and Autism Spectrum Disorders: A Systematic Review.Neuropsychiatr Dis Treat. 2022 Aug 9;18:1679-1695. doi: 10.2147/NDT.S369845. eCollection 2022. Neuropsychiatr Dis Treat. 2022. PMID: 35971415 Free PMC article. Review.
References
-
- Lord C, Risi S, Lambrecht L, Cook EH, Jr, Leventhal BL, DiLavore PC, Pickles A, Rutter M. The autism diagnostic observation schedule-generic: a standard measure of social and communication deficits associated with the spectrum of autism. J Autism Dev Disord. 2000;30:205–223. - PubMed
-
- Ozonoff S. Editorial perspective: autism spectrum disorders in DSM-5–an historical perspective and the need for change. J Child Psychol Psychiatry. 2012;53:1092–1094. - PubMed
-
- Fombonne E, Roge B, Claverie J, Courty S, Fremolle J. Microcephaly and macrocephaly in autism. J Autism Dev Disord. 1999;29:113–119. - PubMed
-
- Courchesne E, Carper R, Akshoomoff N. Evidence of brain overgrowth in the first year of life in autism. JAMA. 2003;290:337–344. - PubMed
-
- Dementieva YA, Vance DD, Donnelly SL, Elston LA, Wolpert CM, Ravan SA, DeLong GR, Abramson RK, Wright HH, Cuccaro ML. Accelerated head growth in early development of individuals with autism. Pediatr Neurol. 2005;32:102–108. - PubMed
Publication types
MeSH terms
Grants and funding
LinkOut - more resources
Full Text Sources
Other Literature Sources

