. 2014 Oct 24;289(43):29519-30.
doi: 10.1074/jbc.M114.607150. Epub 2014 Sep 12.

Short mitochondrial ARF triggers Parkin/PINK1-dependent mitophagy

Affiliations

Short mitochondrial ARF triggers Parkin/PINK1-dependent mitophagy

Karl Grenier et al. J Biol Chem. .

Abstract

Parkinson disease (PD) is a complex neurodegenerative disease characterized by the loss of dopaminergic neurons in the substantia nigra. Multiple genes have been associated with PD, including Parkin and PINK1. Recent studies have established that the Parkin and PINK1 proteins function in a common mitochondrial quality control pathway, whereby disruption of the mitochondrial membrane potential leads to PINK1 stabilization at the mitochondrial outer surface. PINK1 accumulation leads to Parkin recruitment from the cytosol, which in turn promotes the degradation of the damaged mitochondria by autophagy (mitophagy). Most studies characterizing PINK1/Parkin mitophagy have relied on high concentrations of chemical uncouplers to trigger mitochondrial depolarization, a stimulus that has been difficult to adapt to neuronal systems and one unlikely to faithfully model the mitochondrial damage that occurs in PD. Here, we report that the short mitochondrial isoform of ARF (smARF), previously identified as an alternate translation product of the tumor suppressor p19ARF, depolarizes mitochondria and promotes mitophagy in a Parkin/PINK1-dependent manner, both in cell lines and in neurons. The work positions smARF upstream of PINK1 and Parkin and demonstrates that mitophagy can be triggered by intrinsic signaling cascades.

Keywords: Mitochondria; Mitophagy; PTEN-induced Putative Kinase 1 (PINK1); Parkin; Parkinson Disease; smARF.


Figures

FIGURE 1.
FIGURE 1.
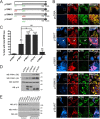
smARF triggers loss of mitochondrial membrane potential and stabilizes PINK1. A, diagram of the p19ARF constructs used in this study: p19WT-FLAG, translated both from Met-1 and Met-45; p19M1I-FLAG, translated from Met-45 only; p19M45I-FLAG, translated from Met-1 only; and p19ΔNT-FLAG, which lacks the first 44 amino acids. B, HeLa cells expressing pcDNA, p19WT-FLAG (p19WT), p19M1I-FLAG (p19M1I), p19M45I-FLAG (p19M45I), or p19ΔNT-FLAG (p19ΔNT) for 24 h and stained with the mitochondrial membrane potential indicator MTR were processed for immunofluorescence against cytochrome c (CytC) and p19 or p14 antibodies. Scale bar, 20 μm for low power and 5 μm for zoom. Arrows, polarized and depolarized mitochondria in the same p19WT-transfected cell. C, the percentage of cells in B negative for MitoTracker Deep Red staining while retaining mitochondrial cytochrome c staining was measured. At least 50 cells were counted per condition per experiment. All columns are compared with pcDNA or with p19WT. n = 3. *, p < 0.05; **, p < 0.01; ***, p < 0.001. D, HeLa cells expressing pcDNA, p19WT, p19M1I, p19M45I, or p19ΔNT for 24 h were lysed, and 50 μg of protein lysate were separated by SDS-PAGE followed by immunoblotting against PINK1, GAPDH, and p19ARF. SE, short exposure; LE, long exposure. *, nonspecific band. E, cells treated as in D were fractionated into cytosolic and mitochondria-enriched fractions and processed for immunoblotting against PINK1, AP-2 (cytosolic), and p32 (mitochondrial) antibodies. WB, Western blot. Error bars, S.E.
FIGURE 2.
FIGURE 2.
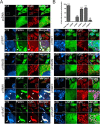
smARF expression leads to translocation of Parkin from the cytosol to mitochondria. A, HeLa cells transduced with eGFP-FLAG-Parkin or eGFP lentivirus for 24 h were transfected with PINK1-Myc, pcDNA, p19WT, p19M1I, p19M45I, p19ΔNT, or PINK1-c-Myc and processed for immunofluorescence after 24 h using cytochrome c (CytC) and p19 or p14 antibodies. Micrographs of both eGFP and eGFP-FLAG-Parkin are shown for p19WT, p19M1I, p19M45I, and p19ΔNT. Only the eGFP-Parkin micrograph is shown for the pcDNA condition. Scale bar, 20 μm for low power and 5 μm for zoom. B, histogram showing the proportion of transfected cells with eGFP-FLAG-Parkin co-localizing with cytochrome c. For each construct, at least 100 cells were counted per condition per experiment. All columns are compared with pcDNA. n = 3. **, p < 0.01; ***, p < 0.001. Error bars, S.E.
FIGURE 3.
FIGURE 3.
smARF induces Parkin recruitment to individual mitochondria with low Δψm and high levels of smARF. HeLa cells transduced with eGFP-FLAG-Parkin for 24 h and transfected with p19ΔNT were stained with MitoTracker Deep Red 24 h after transfection followed by immunofluorescence using cytochrome c (CytC) and p19ARF antibodies. Only cells with incomplete eGFP-FLAG-Parkin translocation to the mitochondria were selected. A representative image is shown in A (scale bar, 20 μm). B, fluorescence intensity plot of the line drawn with ImageJ in A. Arrows, mitochondria with eGFP-Parkin fluorescence. C and D, the mean MitoTracker Deep Red fluorescence intensity (C) or p19ARF intensity (D) of Parkin+ (mitochondria with higher than cell average eGFP-Parkin signal) versus Parkin (mitochondria with lower than cell average eGFP-Parkin signal) mitochondria is plotted. E, point histogram of MitoTracker Deep Red intensity of p19+ (with higher than cell average p19 signal) versus p19 (lower than cell average p19 signal) mitochondria derived from the fluorescence analysis. n = 11. **, p < 0.01; ***, p < 0.001.
FIGURE 4.
FIGURE 4.
smARF triggers Parkin-dependent mitophagy. A, HeLa cells transduced with eGFP-FLAG-Parkin or eGFP for 24 h were transfected with pcDNA, p19WT, p19M1I, p19M45I, or p19ΔNT (not shown) and processed for immunofluorescence after 48 h using cytochrome c (CytC) and p19 or p14 antibodies. Scale bar, 20 μm. B, antibodies against the mitochondrial matrix marker Hsp60 and the inner mitochondrial membrane protein Tim23 were also used to monitor the disappearance of mitochondria in p19M1I-transfected cells. For Tim23, mCherry and mCherry-Parkin transfection was used instead of eGFP and eGFP-FLAG-Parkin lentiviral infection. Scale bar, 20 μm. C, histogram showing the proportion of transfected cells that lacked staining for cytochrome c. At least 50 cells were counted per condition per experiment. All GFP-Parkin conditions are compared with GFP conditions for each construct. All columns are also compared with pcDNA (separately for GFP and GFP-Parkin series). n = 3. ***, p < 0.001. Error bars, S.E.
FIGURE 5.
FIGURE 5.
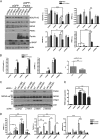
Parkin is essential for smARF-induced mitophagy. A, HeLa cells were transfected with eGFP or eGFP-Parkin along with pcDNA, p19WT, p19M1I, or p19M45I constructs for 48 h. Cells were lysed and processed for immunoblotting against indicated proteins. Levels of mitochondrial proteins NDUFA10, Hsp60, MFN2, and PINK1 are shown in histograms. eGFP conditions are compared with eGFP-Parkin conditions for all constructs, and eGFP-Parkin conditions for each construct are compared with eGFP-Parkin + pcDNA. n = 3. *, p < 0.05; **, p < 0.01; ***, p < 0.001. B, levels of full-length p19ARF, smARF, and the ratio between the two from immunoblots shown in A are plotted in histograms. eGFP conditions are compared with eGFP-Parkin conditions for all constructs, and eGFP-Parkin conditions for each construct are compared with eGFP-Parkin + pcDNA. n = 3. **, p < 0.01; ***, p < 0.001. C, HEK293 cells were treated with NT or Parkin (1989 and 2551) siRNA. pcDNA, p19WT, p19M45I, or p19M1I was transfected 48 h after siRNA transfection, and the cells were harvested 48 h later. 20 μg of mitochondria-enriched fractions were immunoblotted for the indicated proteins. A shift in MFN2 migration (arrow), consistent with ubiquitination is only observed in the presence of endogenous Parkin and smARF and is quantified in a histogram (D). PINK1 and Parkin levels are also quantified in histograms (D). NT, park1989, and park2551 conditions are compared for all constructs, and the NT siRNA + pcDNA condition is compared with each other NT siRNA + (p19 construct) condition. n = 3. **, p < 0.01; ***, p < 0.001. E, HEK293T cells expressing pcDNA, p19WT, p19M1I, p19ΔNT, or p19M45I for 24 h were stained with the mitochondrial membrane potential indicator TMRM, and the cells were sorted by FACS. TMRM-negative cells were plotted. At least 50,000 cells were sorted for each condition per experiment. All columns are compared with pcDNA or with p19WT. n = 3. ***, p < 0.001. Error bars, S.E.
FIGURE 6.
FIGURE 6.
PINK1 is required for smARF-induced Parkin-dependent mitophagy. A, immunoblot showing PINK1 levels after transfection with PINK1-targeted SMARTpool siRNA (24-h treatment) or with individual siRNAs (PINK1-02, -03, and -04) from the SMARTpool (48-h treatment). B–D, HeLa cells were transfected with NT or PINK1 siRNA (SMARTpool for the recruitment experiment and individual PINK1 siRNAs for the mitophagy experiment). After 48 h, the cells were transduced with eGFP-FLAG-Parkin, and 24 h later, they were transduced with pcDNA, p19WT, p19M1I, and p19ΔNT. After a further 24 h (recruitment experiment) or 48 h (mitophagy experiment), the cells were processed for immunofluorescence using Hsp60 and p19 or p14 antibodies. As a further positive control, cells were treated with 20 μm CCCP for either 3 h (recruitment) or 24 h (mitophagy) at 48 h post-transfection. B, histogram showing the proportion of transfected cells with eGFP-Parkin co-localizing with the mitochondrial marker Hsp60. At least 100 cells were counted per condition per experiment. The PINK1 siRNA condition was compared with NT siRNA for each construct. n = 3. ***, p < 0.001. C, micrographs of NT, PINK1-02 (P-02), and PINK1-04 (P-04) siRNA conditions processed for immunofluorescence after 48 h of p19ΔNT expression. Scale bar, 20 μm. Arrows, smARF- and eGFP-Parkin-transfected cells that have either lost (NT condition) or retained (PINK1-02 and PINK1-04 conditions) their mitochondrial staining. D, histogram showing the proportion of transfected cells that lacked staining for Hsp60 for each of the indicated siRNA conditions. At least 50 cells were counted per condition per experiment. PINK1-02 and PINK-04 siRNA conditions are compared with the NT siRNA condition for each construct and for the 24-h CCCP treatment. n = 3. ***, p < 0.001. Error bars, S.E.
FIGURE 7.
FIGURE 7.
smARF induces Parkin/PINK1-dependent mitophagy in neurons. A, cortical neurons generated from embryonic day 14 WT and PINK1−/− embryos were transfected with mCherry-Parkin, GFP-LC3, and either pcDNA, p19WT, p19M1I, p19M45I, or p19ΔNT constructs and processed 24 h later for immunofluorescence using cytochrome c (CytC) and p19 antibodies (only pcDNA and p19ΔNT shown). Scale bar, 20 μm for low power and 5 μm for zoom. Arrows, co-localization of p19ARF, mCherry-Parkin, cytochrome c, and GFP-LC3 (two top arrows) and co-localization of p19ARF, mCherry-Parkin, and GFP-LC3 without cytochrome c (bottom arrow). B, histogram showing the proportion of transfected cells with mCherry-Parkin co-localizing with the mitochondrial marker cytochrome c in WT versus PINK1−/− neurons. At least 25 neurons were counted per condition per experiment. All WT conditions are compared with PINK1−/− for each construct. All columns are also compared with pcDNA (separately for WT and PINK1−/− series) n = 3. **, p < 0.01; ***, p < 0.001. C, histogram showing the proportion of transfected cells with punctate GFP-LC3 staining in WT versus PINK1−/− neurons. At least 25 neurons were counted per condition per experiment. n = 3. All WT conditions are compared with PINK1−/− for each construct. All columns are also compared with pcDNA (separately for WT and PINK1−/− series). **, p < 0.01; ***, = p < 0.001. Error bars, S.E.

Similar articles

Cited by

References

    1. Grenier K., McLelland G. L., Fon E. A. (2013) Parkin- and PINK1-dependent Mitophagy in Neurons: Will the Real Pathway Please Stand Up? Front. Neurol. 4, 100. - PMC - PubMed
    1. Corti O., Brice A. (2013) Mitochondrial quality control turns out to be the principal suspect in parkin and PINK1-related autosomal recessive Parkinson's disease. Curr. Opin. Neurobiol. 23, 100–108 - PubMed
    1. Greene J. C., Whitworth A. J., Kuo I., Andrews L. A., Feany M. B., Pallanck L. J. (2003) Mitochondrial pathology and apoptotic muscle degeneration in Drosophila parkin mutants. Proc. Natl. Acad. Sci. U.S.A. 100, 4078–4083 - PMC - PubMed
    1. Clark I. E., Dodson M. W., Jiang C., Cao J. H., Huh J. R., Seol J. H., Yoo S. J., Hay B. A., Guo M. (2006) Drosophila pink1 is required for mitochondrial function and interacts genetically with parkin. Nature 441, 1162–1166 - PubMed
    1. Park J., Lee S. B., Lee S., Kim Y., Song S., Kim S., Bae E., Kim J., Shong M., Kim J. M., Chung J. (2006) Mitochondrial dysfunction in Drosophila PINK1 mutants is complemented by parkin. Nature 441, 1157–1161 - PubMed

Publication types