. 2014 Sep 11:5:4839.
doi: 10.1038/ncomms5839.

Spatial control of Cdc42 signalling by a GM130-RasGRF complex regulates polarity and tumorigenesis

Affiliations

Spatial control of Cdc42 signalling by a GM130-RasGRF complex regulates polarity and tumorigenesis

Francesco Baschieri et al. Nat Commun. .

Abstract

The small GTPase Cdc42 is a key regulator of polarity, but little is known in mammals about its spatial regulation and the relevance of spatial Cdc42 pools for polarity. Here we report the identification of a GM130-RasGRF complex as a regulator of Cdc42 at the Golgi. Silencing GM130 results in RasGRF-dependent inhibition of the Golgi pool of Cdc42, but does not affect Cdc42 at the cell surface. Furthermore, active Cdc42 at the Golgi is important to sustain asymmetric front-rear Cdc42-GTP distribution in directionally migrating cells. Concurrent to Cdc42 inhibition, silencing GM130 also results in RasGRF-dependent Ras-ERK pathway activation. Moreover, depletion of GM130 is sufficient to induce E-cadherin downregulation, indicative of a loss in cell polarity and epithelial identity. Accordingly, GM130 expression is frequently lost in colorectal and breast cancer patients. These findings establish a previously unrecognized role for a GM130-RasGRF-Cdc42 connection in regulating polarity and tumorigenesis.


Conflict of interest statement

Competing financial interests

The authors declare that no competing financial interests exist.

Figures
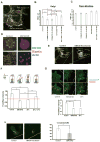
Figure 1
Figure 1. GM130 spatially regulates Cdc42 activity to control polarity
(A) One representative HEK293 cell transfected with the Cdc42-EM FRET reporter is shown. Areas where FRET was measured are marked in red and average FRET values ± standard deviation calculated from 5 independent experiments in control-transfected cells are shown. Scale bar = 25 μm. (B, C) HEK293 cells were transfected with the indicated siRNA. After 48h, cells were transfected with the Cdc42-EM FRET reporter. After additional 24 h, cells were fixed and FRET at the Golgi region (B) or at the plasma membrane (C). Averages of at least 3 independent experiments ± standard deviations (at least 15 cells per condition in every experiment) are shown on the graph. Asterisks indicate statistically significant differences tested using ANOVA with Newman-Keuls multiple comparison test (*p<0.05). (D) Caco-2 cells were transfected with the indicated siRNA. Cells were grown in Geltrex® matrix for four days and cysts were stained for Giantin (red) and GM130 (green) using immunofluorescence and for F-actin (blue) using fluorescent phalloidin. A magnification of a single cyst is displayed in the upper row and an overview of several cysts in shown in the lower row. Scale bar = 7.5 μm for the magnified images (upper images) and 75 μm for the overview images. (E) HeLa cells were transfected with the indicated siRNA. After 48 h, cells were transfected with a plasmid encoding the Cdc42-EM Raichu probe. After 24 h, a wound was generated using a 10 μl pipette tip and cells were allowed to migrate and polarize for approximately 6 h at 37°C followed by fixation. Representative images of cells expressing the Raichu probe that are facing the wound are shown. FRET was measured on the plasma membrane part facing the wound (indicated as “Front”) and on the opposing end of the cell (indicated as “Rear”). Scale bar is 10 μm. (F) Graphic representation of FRET measurements from three independent experiments of HeLa cells expressing the indicated Raichu probe and that that were transfected with the indicated siRNA 72 h prior to the experimental measurements. Above the graph a schematic of the experimental setup: control cells have Cdc42-GTP at the Golgi and deliver it to the leading edge in a polarized way. GM130 knockdown cells have less Cdc42-GTP at the Golgi and lose the ability to polarize their traffic towards the leading edge. Blocking post-Golgi traffic by incubation at 20°C abolishes front-rear asymmetry and re-warming the cells to 37°C re-established asymmetry. White bars represent Front/Rear ratios of FRET values. Results are means ± SD from four independent experiments. Asterisks indicate statistically significant differences tested using ANOVA with Newman-Keuls multiple comparison test (** p<0.01). (G) HeLa cells were transfected with siRNA. After 72 hours, a wound was made with a 10 μl tip and the cells were allowed to migrate for 6 hours. Cells were then fixed and immunostained for Giantin and Cdc42-GTP. Intensities of Cdc42-GTP were measured and the Front/Rear ratio is plotted as a bar graph. Results are means ± SD of 3 independent experiments. Asterisks indicate statistically significant differences tested using ANOVA with Newman-Keuls multiple comparison test (** p<0.01). Scale bar = 25 μm. (H) HeLa cells were transfected with the indicated siRNA. After 48 h, cells were transfected with the plasmid encoding for VSVG-RUSH-GFP. After further 24 h, a wound was made with a 10 μl tip and cells were allowed to migrate at 37°C for approximately 6 hours followed by live video microscopy. VSVG-RUSH-GFP was released from the ER by addition of biotin and after 25 min VSVG carriers were tracked using ImageJ. Individual tracks are displayed on the representative images. Results are means ± SD from three independent experiments. Asterisks indicate statistically significant differences tested using Student’s T-test (** p<0.01).
Figure 2
Figure 2. Models for the GM130-Cdc42 crosstalk
Schematic representation of two different models. On the left-hand side: GM130 acts as a scaffold for a Cdc42-GEF at the Golgi. In this case, a GEF should be located at the Golgi in a GM130 dependent manner. Upon GM130 depletion, the GEF is lost from the Golgi and subsequently, Cdc42-GTP doesn’t accumulate at the organelle. In the second scenario (right-hand side), GM130 binds to an inhibitor of Cdc42, protecting the small GTPase from inactivation. If GM130 is lost, the inhibitor will bind to Cdc42 in places other than the Golgi, thereby preventing a GEF mediated activation of Cdc42. In this way, Cdc42-GTP will not be accumulated at the Golgi.
Figure 3
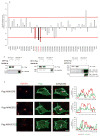
Figure 3. Screening for GEFs that regulate the Golgi pool of Cdc42
(A) HEK293 cells were transfected with control or with the indicated siRNA. After 48h, cells were transfected with the plasmid encoding for the Cdc42-EM-FRET probe. After a further 24h the cells were fixed and mounted. FRET was measured as described in the Material and Methods section and FRET values are displayed as fold of control and are averages from the measurements of at least 30 cells per condition. Red bars represent CI95 intervals (B) HeLa cells were transfected with plasmids encoding the indicated GEF. 24 h later, cells were lysed and the lysates were subjected to immunoprecipitation either with a GM130 antibody (+) or with protein G sepharose beads alone. “5% input” indicates lanes where 5% of the total material that was used in the IP is loaded. The immunoprecipitated material was eluted and subjected to SDS-PAGE followed by immunoblotting against the indicated proteins. (C) HeLa cells were plated on coverslips, then transfected with plasmids encoding the specified GEF. 24 h later, cells were fixed and immunostained for GM130 and Flag. Intensity plot corresponding to the region marked by a white arrow are shown on the right. Scale bar is 10 μm.
Figure 4
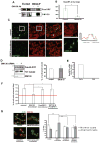
Figure 4. The effect of GM130 on Cdc42 is dependent on RasGRF
(A) HeLa cells were lysed and the lysate was subjected to immunoprecipitation either with a GM130 antibody (+) or with protein G sepharose beads alone. “5% input” indicates lanes where 5% of the total material that was used in the IP is loaded. The immunoprecipitated material was eluted and subjected to SDS-PAGE followed by immunoblotting against the indicated protein. (B) Quantification of cells with RasGRF at the Golgi. (C) HeLa cells grown on glass cover slips were fixed followed by immunofluorescence staining of RasGRF and GM130. Images were acquired using a confocal laser-scanning microscope. The magnifications correspond to the areas inside the white squares. Scale bar is 25 μm. An intensity plot corresponding to the region marked by a white arrow is shown. (D) CHL cells were depleted of GM130 by siRNA transfection. After 72 h, cells were lysed and GST-PAK1 was added to the lysate followed by pulldown with GSH-sepharose. The eluate was subjected to SDS-PAGE followed by immunoblotting against Cdc42 (Cdc42-GTP). 5% of the original lysate were subjected to SDS-PAGE followed by immunoblotting against Cdc42 (Tot-Cdc42) and against GM130. Bar graph in the right panel represents a quantification of the amount active Cdc42 (GTP-Cdc42) to total Cdc42. Results are means ± SD from three independent experiments. (E) RT-PCR of RasGRF2 comparing HeLa and CHL cells. (F) Cells were transfected with the indicated siRNA. After 72 h, a wound was made using a 10μl pipette tip and cells were allowed to migrate and polarize for approximately 6 h at 37°C followed by fixation and immunofluorescence staining of Giantin to label the Golgi. The Golgi was counted as oriented towards the wound if its major mass was located in a 120° angle facing the wound edge. The red line shows the average orientation of the Golgi immediately after wounding. Results are means ± SD from three independent experiments. Asterisk indicates statistically significant differences using ANOVA with Newman-Keuls multiple comparison test (*p<0.05). (G) Caco-2 cells were transfected with siRNA against GM130, or RasGRF2, or with both siRNA. Cells were grown in Matrigel® for four days to allow cyst formation. Afterwards, cysts were stained for GM130 using immunofluorescence and for F-actin using fluorescent phalloidin as described in “Materials and Methods”. Cysts with a single lumen were counted as normal, while cysts with multiple or no lumen were counted as aberrant. The percentage of normal and aberrant cysts in each condition was counted from three independent experiments which are displayed in the bar graph in the lower panel. Results are means ± SD. Asterisk indicates statistically significant differences using ANOVA with Newman-Keuls multiple comparison test (*p<0.05; **p<0.01). Scale bar is 7.5 μm.
Figure 5
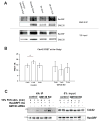
Figure 5. The GM130-RasGRF complex is regulated by serum
(A) MCF7 cells were grown to confluency. Then, cells were serum-starved for 2 h followed by stimulation with 10% FCS for the indicated time points. Cell lysates were subjected to immunoprecipitation against GM130. The immunoprecipitate was subjected to SDS-PAGE followed by immunoblotting against the indicated proteins. (B) HeLa cells were transfected with control or GM130 siRNA 72h prior to the experiment. After 48 h, cells were transfected with the plasmid encoding for the Cdc42 Raichu probe. Cells were serum-starved for 2 h followed by stimulation with 10% FCS for 0,1 and 5 min and FRET was measured as indicated in “Materials and Methods. Results are means ± SD from three independent experiments. Asterisks indicate statistically significant differences tested using ANOVA with Newman-Keuls multiple comparison test (*p<0.05). (C) HeLa cells were transfected with the indicated siRNA. After 48 h, cells were transfected with empty vector or with a plasmid encoding HA-tagged RasGRF1. After 24 h, cells were serum-starved for 2 h followed by stimulation with 10% FCS for the indicated time points. Cell lysates were subjected to immunoprecipitation against HA. The immunoprecipitate was subjected to SDS-PAGE followed by immunoblotting against the indicated proteins.
Figure 6
Figure 6. GM130 depletion increases Ras activity
(A) Working model: GM130 acts as a suppressor of RasGRF activity, thereby modulating the activities of Ras and Cdc42. According to this model, the knockdown of GM130 results in increased Ras activation and decreased Cdc42 activation. (B) HepG2 cells were transfected with the indicated siRNAs. After 72 h, cells were lysed and Ras pull-down was performed using GST-RBD. The eluate form the beads was subjected to SDS-PAGE followed by immunoblotting with a pan-Ras antibody (Ras-GTP). 5% of the original lysate was subjected to SDS-PAGE followed by immunoblotting against tubulin and GM130. Bar graph represents a quantification of the amount active Ras (Ras-GTP) normalized to tubulin. Results are means ± SD from three independent experiments. Asterisks indicate statistically significant differences tested using ANOVA with Newman-Keuls multiple comparison test (*p<0.05; ** p<0.01).
Figure 7
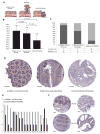
Figure 7. Dysregulation of GM130 in human colon cancer
GM130 expression was measured by IHC on a Colon Progression TMA. (A) Graphic representation of the neoplastic evolution of colon carcinoma from the normal colon mucosa through the adenoma. (B) Bar graphs depicting the average expression level (± SD) of GM130 in Normal Colon Mucosa, Colon Tubulovillous Adenomas and Colon Adenocarcinomas or (C) the percentage of low and high GM130-expressing samples when using a cut off score value of 1.5 (differences are significant as assessed by Pearson χ2 analysis P < 0.001). (D) Representative images of immunohistochemical staining for GM130. (E) Bar graphs depict the expression score of GM130 in 16 patients for which matched normal and tumor tissue were available on the TMAs. GM130 is downregulated in colon cancer with respect to the normal colon mucosa in 14 out of 16 patients. (F) Representative core images of normal and tumor tissue from patient 14 and 19. Scale bar, 100 μm

Similar articles

Cited by

References

    1. Etienne-Manneville S. Cdc42 - the centre of polarity. J Cell Sci. 2004;117:1291–1300. - PubMed
    1. Iden S, et al. Tumor Type-Dependent Function of the Par3 Polarity Protein in Skin Tumorigenesis. Cancer Cell. 2012;22:389–403. - PubMed
    1. McCaffrey Luke M, Montalbano J, Mihai C, Macara Ian G. Loss of the Par3 Polarity Protein Promotes Breast Tumorigenesis and Metastasis. Cancer cell. 2012;22:601–614. - PMC - PubMed
    1. Xue B, Krishnamurthy K, Allred DC, Muthuswamy SK. Loss of Par3 promotes breast cancer metastasis by compromising cell–cell cohesion. Nat Cell Biol. 2012;15:189–200. - PMC - PubMed
    1. Erickson JW, Zhang C-j, Kahn RA, Evans T, Cerione RA. Mammalian Cdc42 Is a Brefeldin A-sensitive Component of the Golgi Apparatus. Journal of Biological Chemistry. 1996;271:26850–26854. - PubMed

Publication types

MeSH terms