. 2014 Sep 8;30(5):598-609.
doi: 10.1016/j.devcel.2014.07.026.

An ankyrin repeat domain of AKR2 drives chloroplast targeting through coincident binding of two chloroplast lipids

Affiliations

An ankyrin repeat domain of AKR2 drives chloroplast targeting through coincident binding of two chloroplast lipids

Dae Heon Kim et al. Dev Cell. .

Abstract

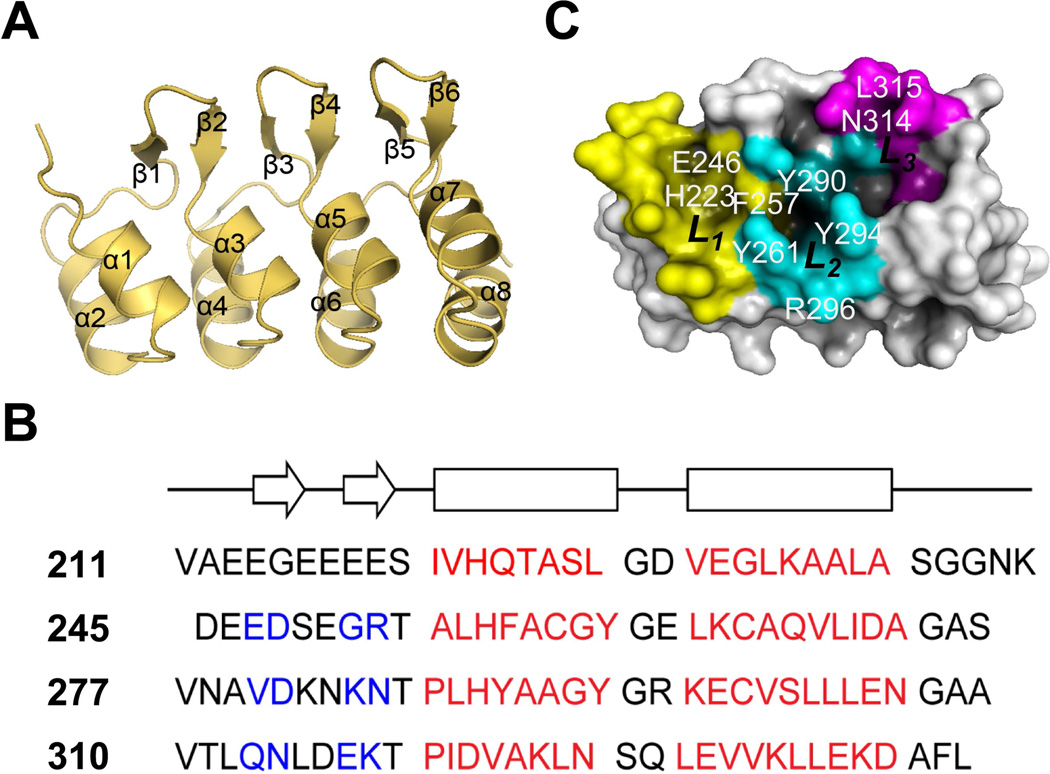
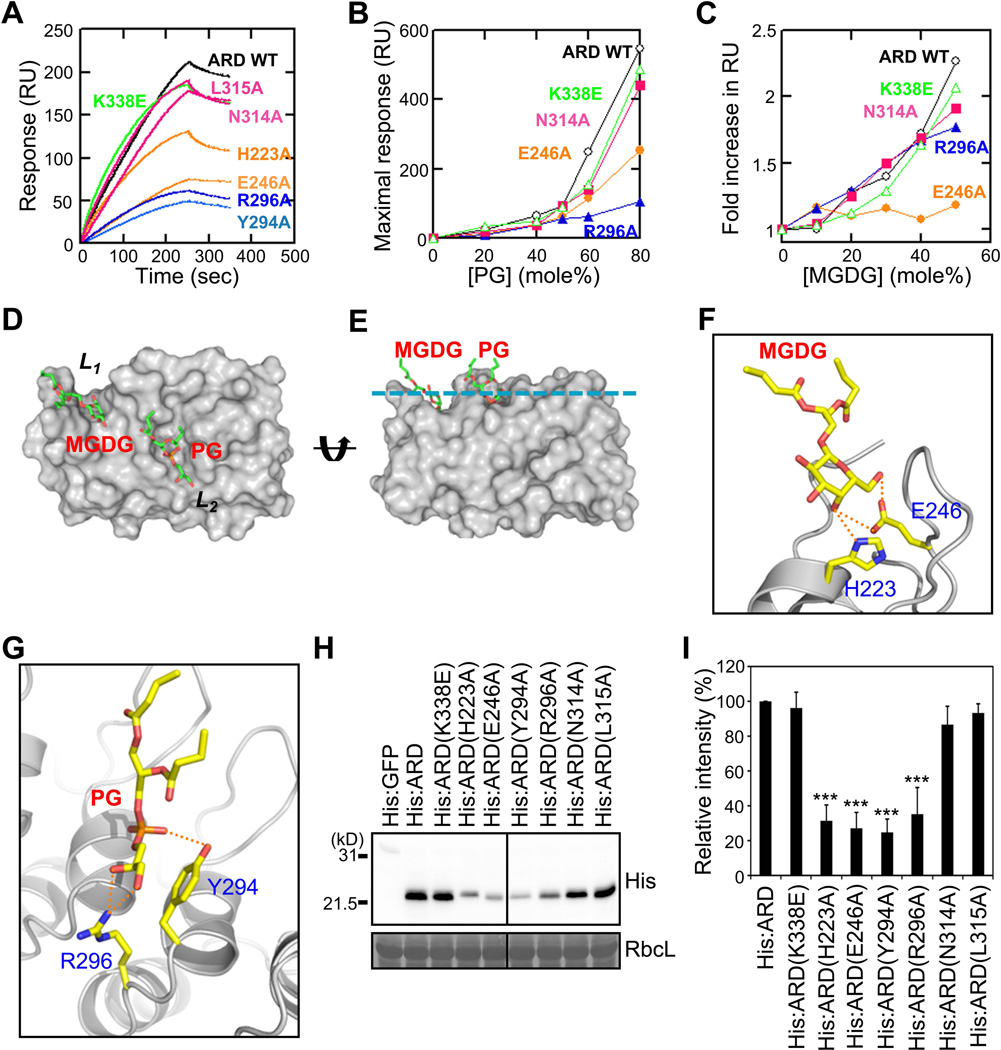
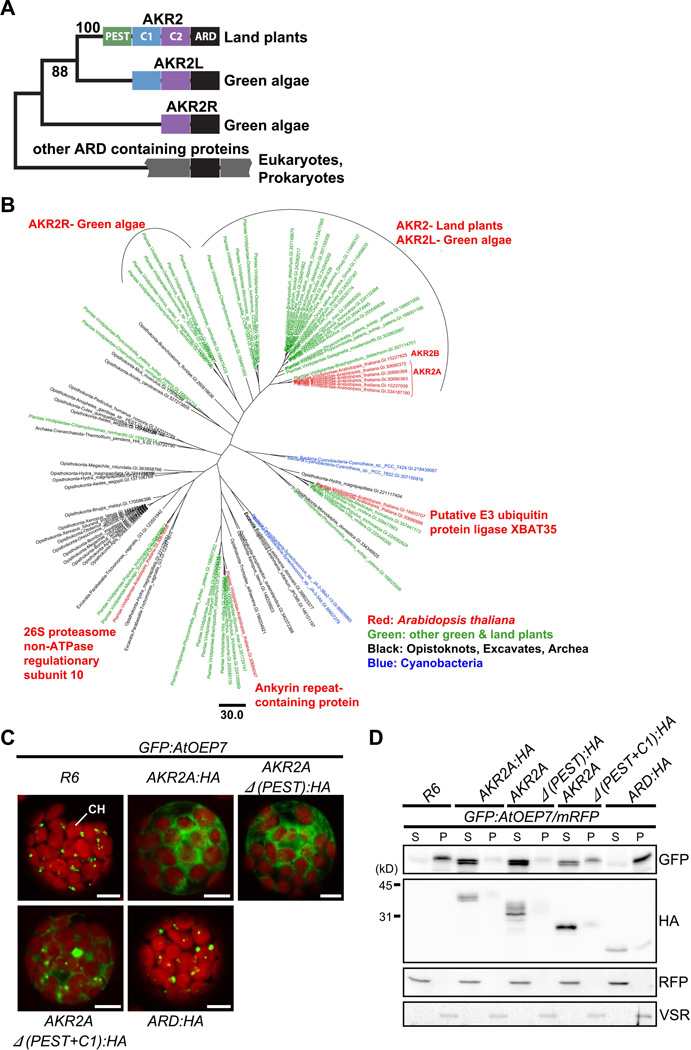
In organellogenesis of the chloroplast from endosymbiotic cyanobacteria, the establishment of protein-targeting mechanisms to the chloroplast should have been pivotal. However, it is still mysterious how these mechanisms were established and how they work in plant cells. Here we show that AKR2A, the cytosolic targeting factor for chloroplast outer membrane (COM) proteins, evolved from the ankyrin repeat domain (ARD) of the host cell by stepwise extensions of its N-terminal domain and that two lipids, monogalactosyldiacylglycerol (MGDG) and phosphatidylglycerol (PG), of the endosymbiont were selected to function as the AKR2A receptor. Structural analysis, molecular modeling, and mutational analysis of the ARD identified two adjacent sites for coincidental and synergistic binding of MGDG and PG. Based on these findings, we propose that the targeting mechanism of COM proteins was established using components from both the endosymbiont and host cell through a modification of the protein-protein-interacting ARD into a lipid binding domain.


Figures

Figure 1
Figure 1. AKR2A recognizes the lipid components of chloroplasts for its binding
(A) The effect of trypsin treatment on AKR2A binding to chloroplasts. His:AKR2A was incubated with chloroplasts treated with (+) or without (−) trypsin and the amount of His:AKR2A copurified with chloroplasts was determined by Western blot analysis using anti-His, anti-AtToc75 and anti-Toc159 antibodies. The amount of AtToc75 and AtToc159 was analyzed as internal control for trypsin treatment. (B–E) Effect of duramycin and sugars on AKR2A-chloroplast binding. (B and C) AKR2A binding to chloroplasts treated with (+) or without (−) duramycin (B) or in the presence of the indicated sugars (C). (B and C) Western blots analysis of AKR2A binding to chloroplasts using anti-His antibody. (D and E) quantification of AKR2A binding to chloroplasts. Mean ± standard deviation (SD) are shown (n = 3). C, control (no sugar); glc, glucose; gal, galactose; gly, glyceraldehyde; ara, arabinose. The asterisks indicate a significant difference from the corresponding control experiment by Student’s t-test (*P < 0.05; **P < 0.01; ***P < 0.001). See also Figure S1.
Figure 2
Figure 2. Membrane binding properties of AKR2A and ARD
(A) ARD shows negligible binding to PC vesicles when compared with PG/MGDG (50:50) vesicles. (B) MGDG-dependent vesicle binding of full-length (FL) AKR2A (red) and ARD (blue) with POPC/MGDG [(100−x):x; x, mole% of MGDG] (open symbols) or POPG/POPC/MGDG [50:(50−x):x] (closed symbols) vesicles and maximal binding response values plotted against MGDG concentration. (C) Specificity of ARD for MGDG over DGDG. Notice that binding to PG/DGDG (50:50) vesicles is comparable to that of PG/PC (50:50) vesicles, showing that the affinity for DGDG alone is as low as that for PC. (D) Determination of Kd for ARD binding to PG/PC (50:50) vesicles by equilibrium SPR analysis. The binding isotherm was generated from the response at equilibrium (Req)(average of triplicate measurements) versus the ARD concentration (P0) plot. A solid line represents a theoretical curve constructed from the Rmax (330 ± 20) and Kd (1200 ± 110 nM) values determined by a nonlinear least squares analysis of the isotherm using the following equation: Req = Rmax/(1 + Kd/P0). (E) Determination of Kd for ARD binding to PG/MGDG (50:50) vesicles by equilibrium SPR analysis as described for Figure 3D. Rmax = 290 ± 30 and Kd = 360 ± 70 nM. (F) PG-dependent vesicle binding of the ARD with POPC/POPG [(100−x):x] (blue) or POPC/POPG/MGDG [(60−x):x:40] (red) vesicles and maximal binding response values plotted against PG concentration. (G) PG specificity of ARD. Binding of the ARD (0.5 µM) to PC/PG [(100−x):x] (red), PC/PS [(100−x):x] (blue) or PC/PI [(100−x):x] (black) vesicles was measured by kinetic SPR analysis, and maximal binding response values were plotted against anionic lipid concentrations. (H) Determination of Kd for full-length AKR2A binding to PG/MGDG (50:50) vesicles by equilibrium SPR analysis as described for Figure 2D. Rmax = 230 ± 20 and Kd = 390 ± 60 nM. (I) AKR2A showed significantly higher binding to chloroplast-mimicking vesicles (MGDG/DGDG/PC/PG/PI/sulfoquinovosyldiacylglycerol = 17:29:32:10:6:6) than to 100% PC vesicles and its binding to chloroplast-mimicking vesicles was comparable to that to PG/MGDG vesicles (50:50). For SPR data, each point represents the average of triplicate measurements (n = 3). RU, resonance unit.
Figure 3
Figure 3. Chloroplast binding of AKR2A is impaired in mgd1 and pgp1-1 mutants
(A and B) His:AKR2A binding to chloroplasts from WT, mgd1 or pgp1-1 plants. (A) Western blot analysis of His:AKR2A bound to chloroplasts using anti-His antibody. RbcL, loading control stained with Coomassie blue. (B) Quantification of His:AKR2A binding to mgd1, pgp1-1 or WT chloroplasts. Mean ± SD are shown (n = 3). (C and D) The effect of the yPGC1 treatment to chloroplasts on AKR2A binding. (C) His:AKR2A binding to chloroplasts was examined as in (A) except that chloroplasts had been treated with His:yPGC1 before its use in binding experiments. (D) Quantification of His:AKR2A binding to His:yPGC1-treated chloroplasts. Mean ± SD are shown (n = 3). (E and F) Effect of daptomycin on AKR2A binding to chloroplasts. (E) His:AKR2A binding to chloroplasts was examined as in (A) except that chloroplasts had been treated with daptomycin before its use in binding assay. (F) Quantification of His:AKR2A binding to daptomycin-treated chloroplasts. Mean ± SD are shown (n = 3). (G and H) The binding of annexin V to chloroplasts. (G) mCherry:annexin V or mCherry alone was introduced into protoplasts and chloroplast fractions from the transformed protoplasts were analyzed by Western blotting using anti-RFP antibody. mCherry alone was used as a control for fractionation. T, total protoplast extracts; CH, chloroplast fractions. (H) Quantification of the chloroplast-bound mCherry:annexin V. Mean ± SD are shown (n = 3). The asterisks indicate a significant difference from the corresponding control experiment by Student’s t-test (*P < 0.05; **P < 0.01; ***P < 0.001). See also Figure S2.
Figure 4
Figure 4. Targeting of proteins to the COM is impaired in mgd1 and pgp1-1 mutants
(A–D) The targeting efficiency of COM proteins in mgd1 and pgp1-1 mutants. (A and C) Targeting of AtOEP7:GFP (A) or AtToc64:GFP (C) to chloroplasts in WT, mgd1 or pgp1-1 protoplasts. mRFP, a control for the transformation efficiency and chloroplast fractionation. RbcL, loading control. NT, non-transformed; To, total protoplast extracts; CH, chloroplast fractions. (B and D) Quantification of the chloroplast targeting of AtOEP7:GFP (B) or AtToc64:GFP (D). Mean ± SD are shown (n = 3). (E and F) Chloroplast protein levels in mgd1 and pgp1-1 mutants. (E) Western blot analysis of various endogenous protein levels. Actin, loading control. (F) Quantification of the protein levels in mgd1 and pgp1-1 plants. The protein levels were normalized using Actin. The expression level in WT plants was set to 1. Mean ± SD are shown (n = 3). The asterisks indicate a significant difference from the corresponding control experiment by Student’s t-test (*P < 0.05; **P < 0.01; ***P < 0.001). See also Figure S3.
Figure 5
Figure 5. The overall structure of ARD
(A) The crystal structure ARD of AKR2A at 2.3 Å resolution. (B) Four ankyrin repeats of AKR2A are aligned according to their structure. Arrows and rectangles indicate the approximate locations of the β-strands (blue) and α-helices (red), respectively. (C) The putative membrane binding surface of the ARD. There are three grooves (L1, L2, and L3 in yellow, cyan, and magenta, respectively, with key residues constituting each site indicated) that can accommodate lipid headgroups. See also Table S1.
Figure 6
Figure 6. Identification of the MGDG- and PG-binding sites of the AKR2A ARD
(A) SPR sensorgrams of ARD mutants interacting with POPC/POPG (50:50) vesicles. (B) Measurement of the PG-dependent vesicle binding of the ARD mutants with POPC/POPG [(100−x):x] vesicles and maximal binding response values plotted against PG concentration. (C) The MGDG-dependent vesicle binding of the ARD mutants. Maximal response values for ARD mutants interacting with POPG/POPC/MGDG [50:(50−x):x] vesicles measured at each MGDG concentration. Mutants in each group (L1, L2 and L3) show similar properties; thus, data for a representative mutant for each group (E246A for L1, R296A for L2, and N314A for L3) are shown in B and C for clarity. L1, L2, L3 site mutants are represented by orange, blue, and magenta, respectively. For SPR data, each point represents the average of triplicate measurements. RU, resonance unit. n = 3. (D and E) A modeled structure of the ARD-PG-MGDG complex in two different orientations. (D) The ARD is shown in the same molecular orientation as in Figure 6C. (E) The structure is horizontally rotated 90° to show its membrane binding orientation. The cyan line indicates the putative membrane surface. (F) Predicted hydrogen bonds between the MGDG headgroup and two key residues, H223 and E246, in the L1 pocket are shown as green dotted lines. (G) Potential hydrogen bonds between the PG headgroup and two key residues, Y294 and R296, in the L2 pocket are shown as green dotted lines. The ternary complex model is identical to that shown in Figure 6D and 6E. The molecular orientations are arbitrarily selected for the best illustration of potential interactions. Although two key residues are shown for each site, many other protein residues can also participate in short-range interactions with lipid headgroups and acyl chains. Lipids are in stick representation and proteins in ribbon representation. (H) Chloroplast binding of ARD and L1, L3, and L3 site mutants (see Figure 5C). RbcL, loading control. (I) Chloroplast binding of L1, L3, and L3 site mutants was presented as relative values to that of His:ARD. Mean ± SD are shown (n = 3). The asterisks indicate a significant difference from the corresponding control experiment by Student’s t-test (*P < 0.05; **P < 0.01; ***P < 0.001). See also Figure S4.
Figure 7
Figure 7. The Phylogenetic tree of ARDs and the evolution of AKR2A
(A) The domain structure of ARD-containing proteins. The PEST (green), C1 (blue), C2 (purple) and ARD domains are highlighted in different colors. In cyanobacterial ARD-containing proteins, only the ARD domain (black) is shown. (B) Maximum likelihood phylogenetic tree of ARDs. The tree is built on an alignment of 115 amino acid residues of the ARDs of 93 sequences. (C and D) The effect of C1 and C2 domains on AKR2A binding to GFP:AtOEP7. (C) GFP:AtOEP7 was introduced into protoplasts together with HA-tagged full-length or various deletion mutants of AKR2A or empty vector R6 and the localization pattern of GFP:AtOEP7 was examined. CH, chloroplasts. Bar, 10 µm. (D) Fractionation of GFP:AtOEP7. Protoplasts were transformed with GFP:AtOEP7 and AKR2A as in (C). mRFP was included in all transformation as a control for transformation efficiency and fractionation. Protoplast lysates were separated into soluble and pellet fractions and analyzed by Western blotting using anti-GFP, anti-HA, anti-RFP and anti-VSR antibodies. VSR was used as a control for membrane proteins. S, soluble fraction; P, pellet fraction. See also Figure S5.

Comment in

Similar articles

Cited by

References

    1. Adams PD, Afonine PV, Bunkóczi G, Chen VB, Davis IW, Echols N, Headd JJ, Hung LW, Kapral GJ, Grosse-Kunstleve RW, McCoy AJ, Moriarty NW, Oeffner R, Read RJ, Richardson DC, Richardson JS, Terwilliger TC, Zwart PH. PHENIX: a comprehensive Python-based system for macromolecular structure solution. Acta. Crystallogr D. 2010;66:213–221. - PMC - PubMed
    1. Ananthanarayanan B, Stahelin RV, Digman MA, Cho W. Activation mechanisms of conventional protein kinase C isoforms are determined by the ligand affinity and conformational flexibility of their C1 domains. J. Biol. Chem. 2003;278:46886–46894. - PubMed
    1. Babiychuk E, Müller F, Eubel H, Braun HP, Frentzen M, Kushnir S. Arabidopsis phosphatidylglycerophosphate synthases 1 is essential for chloroplast differentiation, but is dispensable for mitochondrial function. Plant J. 2003;33:899–909. - PubMed
    1. Bae W, Lee YJ, Kim DH, Lee J, Kim S, Sohn EJ, Hwang I. AKR2A-mediated import of chloroplast outer membrane proteins is essential for chloroplast biogenesis. Nature Cell Biol. 2008;10:220–227. - PubMed
    1. Barrick D, Ferreiro DU, Komives EA. Folding landscapes of ankyrin repeat proteins: experiments meet theory. Curr. Opin. Struct. Biol. 2008;18:27–34. - PMC - PubMed

Publication types

MeSH terms

LinkOut - more resources