

An atomic model of brome mosaic virus using direct electron detection and real-space optimization
- PMID: 25185801
- PMCID: PMC4155512
- DOI: 10.1038/ncomms5808
An atomic model of brome mosaic virus using direct electron detection and real-space optimization
Abstract
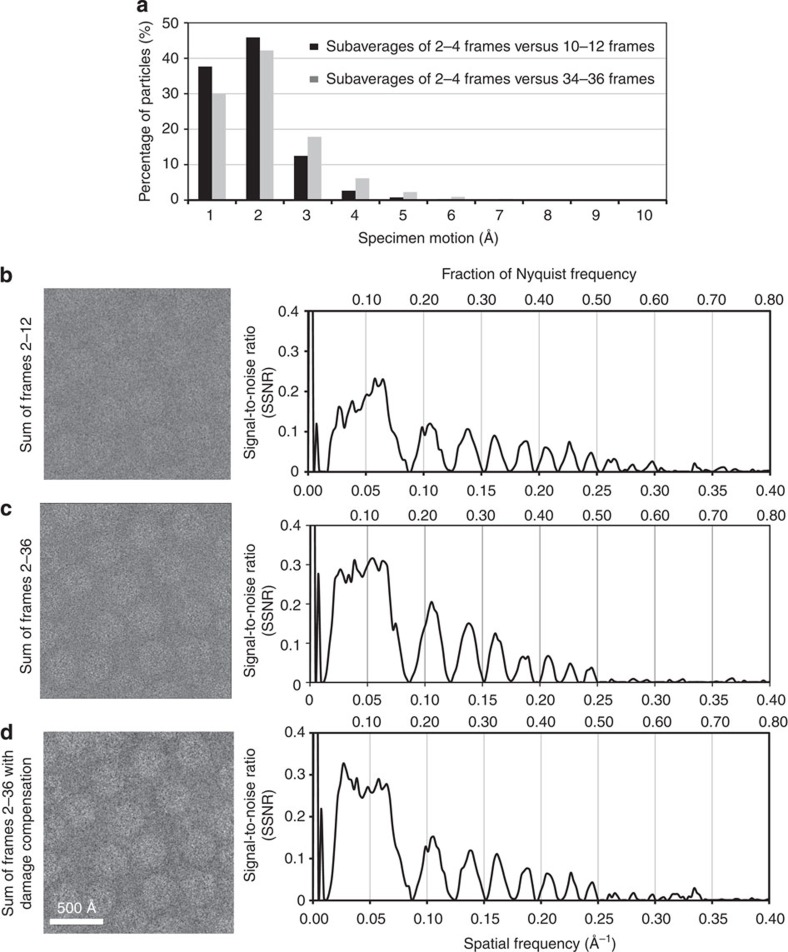
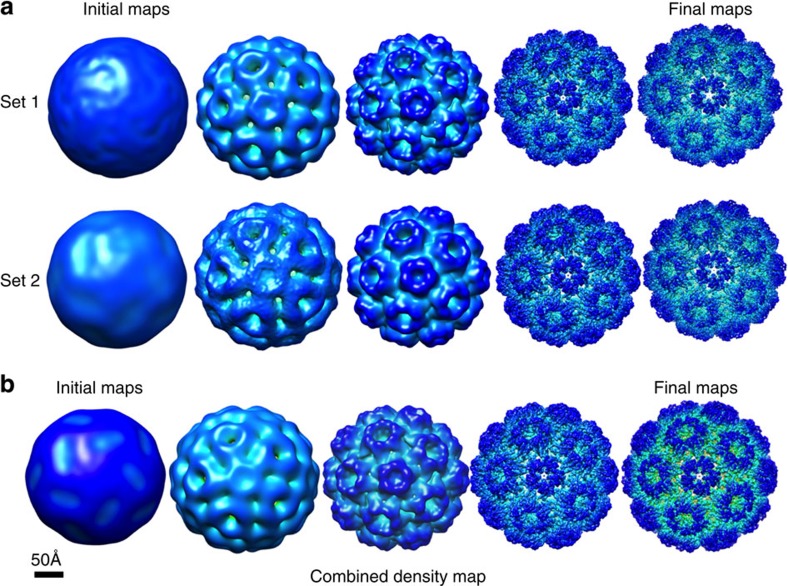
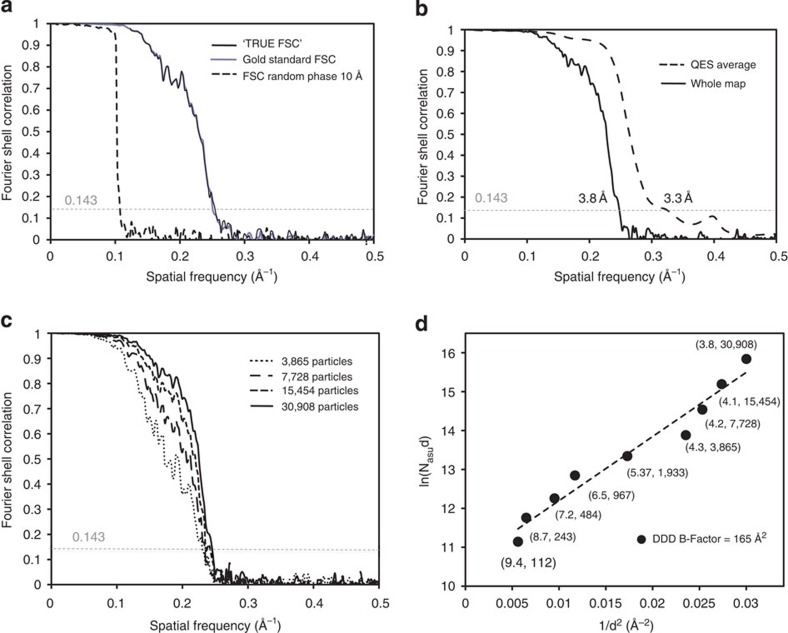
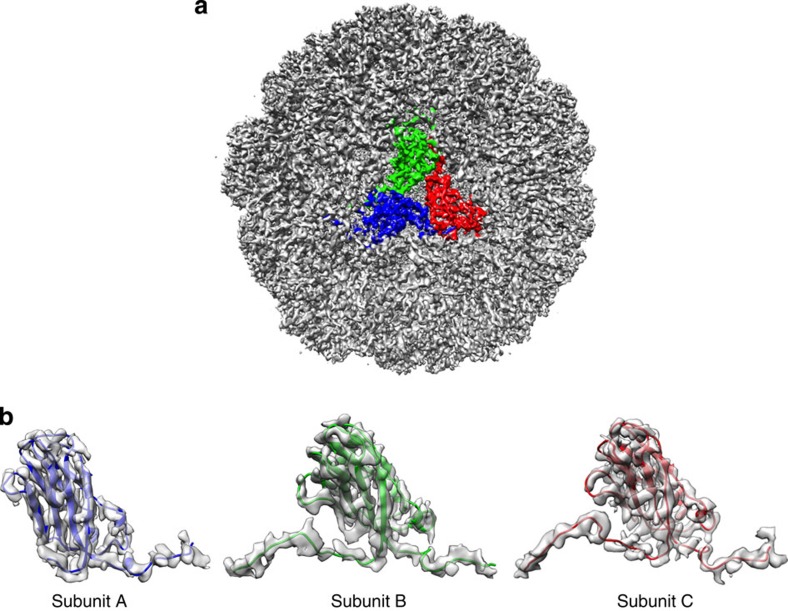
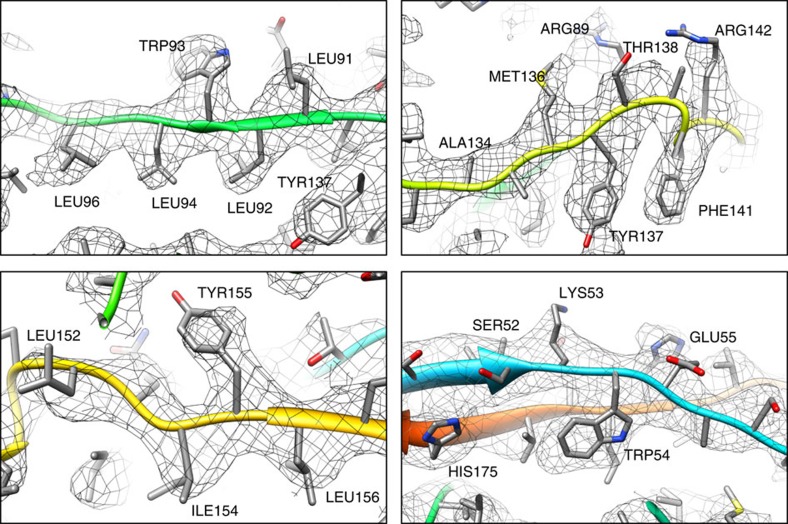
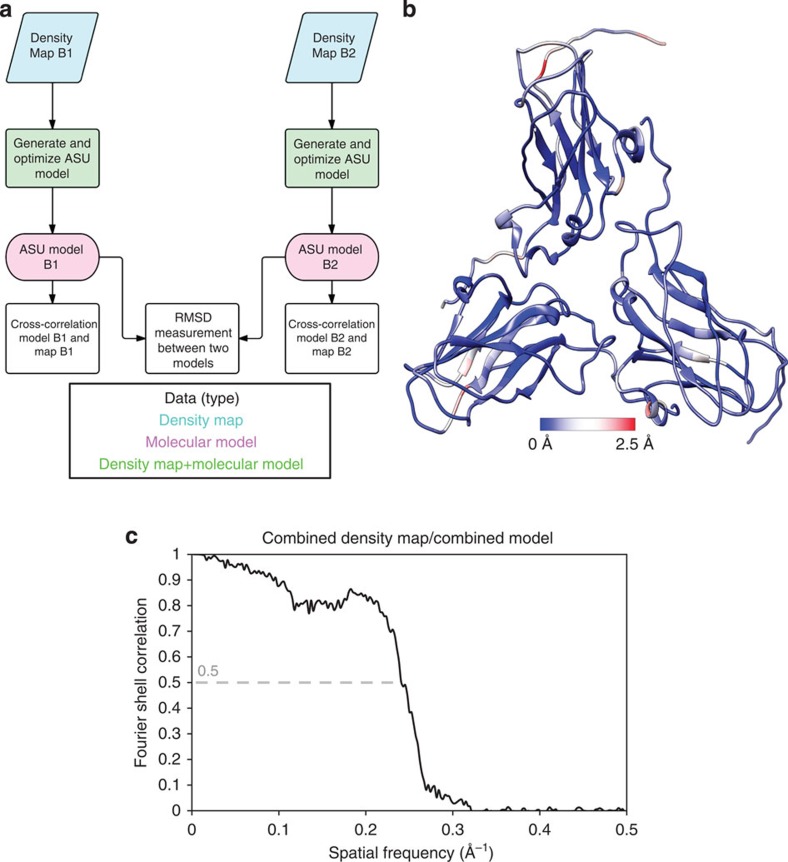
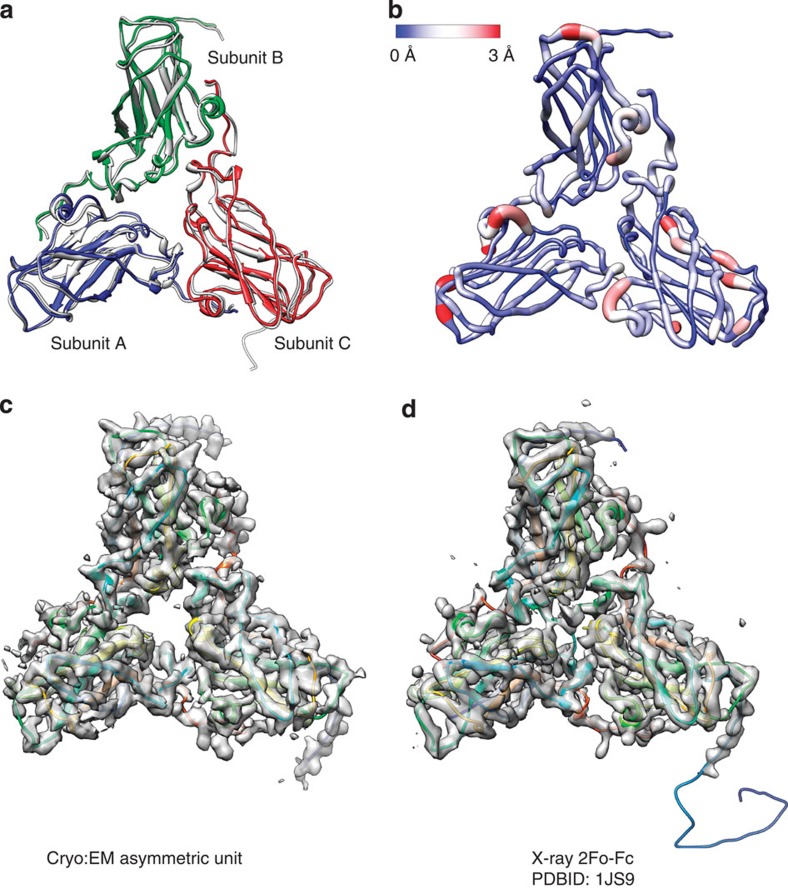
Advances in electron cryo-microscopy have enabled structure determination of macromolecules at near-atomic resolution. However, structure determination, even using de novo methods, remains susceptible to model bias and overfitting. Here we describe a complete workflow for data acquisition, image processing, all-atom modelling and validation of brome mosaic virus, an RNA virus. Data were collected with a direct electron detector in integrating mode and an exposure beyond the traditional radiation damage limit. The final density map has a resolution of 3.8 Å as assessed by two independent data sets and maps. We used the map to derive an all-atom model with a newly implemented real-space optimization protocol. The validity of the model was verified by its match with the density map and a previous model from X-ray crystallography, as well as the internal consistency of models from independent maps. This study demonstrates a practical approach to obtain a rigorously validated atomic resolution electron cryo-microscopy structure.
Figures
Similar articles
-
Tools for Model Building and Optimization into Near-Atomic Resolution Electron Cryo-Microscopy Density Maps.Methods Enzymol. 2016;579:255-76. doi: 10.1016/bs.mie.2016.06.003. Epub 2016 Aug 12. Methods Enzymol. 2016. PMID: 27572730 Free PMC article. Review.
-
Cryo-EM Structure Determination Using Segmented Helical Image Reconstruction.Methods Enzymol. 2016;579:307-28. doi: 10.1016/bs.mie.2016.05.034. Epub 2016 Jun 28. Methods Enzymol. 2016. PMID: 27572732 Review.
-
Refinement of Atomic Structures Against cryo-EM Maps.Methods Enzymol. 2016;579:277-305. doi: 10.1016/bs.mie.2016.05.033. Epub 2016 Jun 24. Methods Enzymol. 2016. PMID: 27572731 Review.
-
Cryo electron microscopy to determine the structure of macromolecular complexes.Methods. 2016 Feb 15;95:78-85. doi: 10.1016/j.ymeth.2015.11.023. Epub 2015 Nov 27. Methods. 2016. PMID: 26638773 Free PMC article. Review.
-
Structural interpretation of cryo-EM image reconstructions.Prog Biophys Mol Biol. 2021 Mar;160:26-36. doi: 10.1016/j.pbiomolbio.2020.07.004. Epub 2020 Jul 29. Prog Biophys Mol Biol. 2021. PMID: 32735944
Cited by
-
Structure of the 30 kDa HIV-1 RNA Dimerization Signal by a Hybrid Cryo-EM, NMR, and Molecular Dynamics Approach.Structure. 2018 Mar 6;26(3):490-498.e3. doi: 10.1016/j.str.2018.01.001. Epub 2018 Feb 2. Structure. 2018. PMID: 29398526 Free PMC article.
-
Shigella Phages Isolated during a Dysentery Outbreak Reveal Uncommon Structures and Broad Species Diversity.J Virol. 2018 Mar 28;92(8):e02117-17. doi: 10.1128/JVI.02117-17. Print 2018 Apr 15. J Virol. 2018. PMID: 29437962 Free PMC article.
-
Subunit conformational variation within individual GroEL oligomers resolved by Cryo-EM.Proc Natl Acad Sci U S A. 2017 Aug 1;114(31):8259-8264. doi: 10.1073/pnas.1704725114. Epub 2017 Jul 14. Proc Natl Acad Sci U S A. 2017. PMID: 28710336 Free PMC article.
-
Evolution of standardization and dissemination of cryo-EM structures and data jointly by the community, PDB, and EMDB.J Biol Chem. 2021 Jan-Jun;296:100560. doi: 10.1016/j.jbc.2021.100560. Epub 2021 Mar 18. J Biol Chem. 2021. PMID: 33744287 Free PMC article. Review.
-
Model-based local density sharpening of cryo-EM maps.Elife. 2017 Oct 23;6:e27131. doi: 10.7554/eLife.27131. Elife. 2017. PMID: 29058676 Free PMC article.
References
Publication types
MeSH terms
Associated data
- Actions
- Actions
- Actions
Grants and funding
- T32 GM008280/GM/NIGMS NIH HHS/United States
- T15LM007093/LM/NLM NIH HHS/United States
- P01 GM063210/GM/NIGMS NIH HHS/United States
- P41GM103832/GM/NIGMS NIH HHS/United States
- P41 GM103832/GM/NIGMS NIH HHS/United States
- R01GM063210/GM/NIGMS NIH HHS/United States
- R01 GM079429/GM/NIGMS NIH HHS/United States
- R01GM079429/GM/NIGMS NIH HHS/United States
- T15 LM007093/LM/NLM NIH HHS/United States
- R44GM103417/GM/NIGMS NIH HHS/United States
- R01 AI090280/AI/NIAID NIH HHS/United States
- R44 GM103417/GM/NIGMS NIH HHS/United States
- R01AI090280/AI/NIAID NIH HHS/United States
LinkOut - more resources
Full Text Sources
Other Literature Sources
