

DNA methylation analysis of the autistic brain reveals multiple dysregulated biological pathways
- PMID: 25180572
- PMCID: PMC4203003
- DOI: 10.1038/tp.2014.70
DNA methylation analysis of the autistic brain reveals multiple dysregulated biological pathways
Abstract
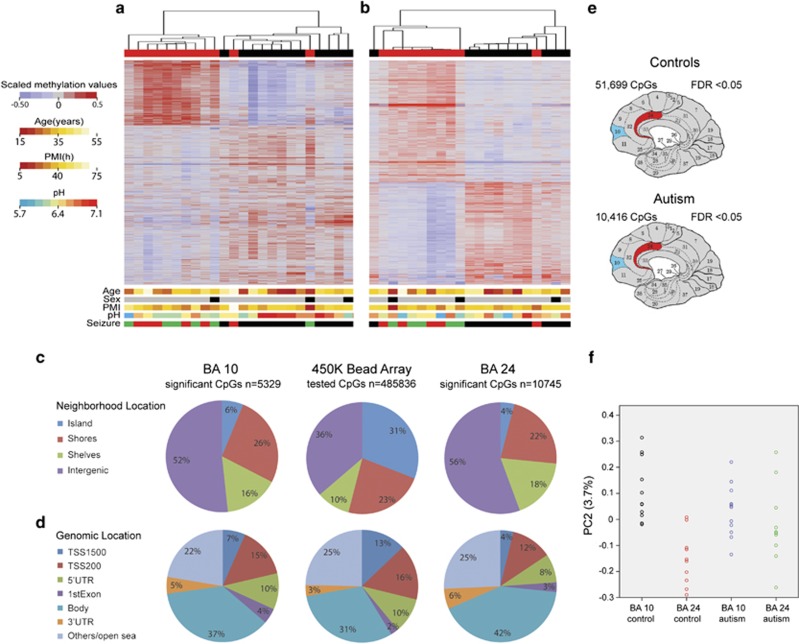
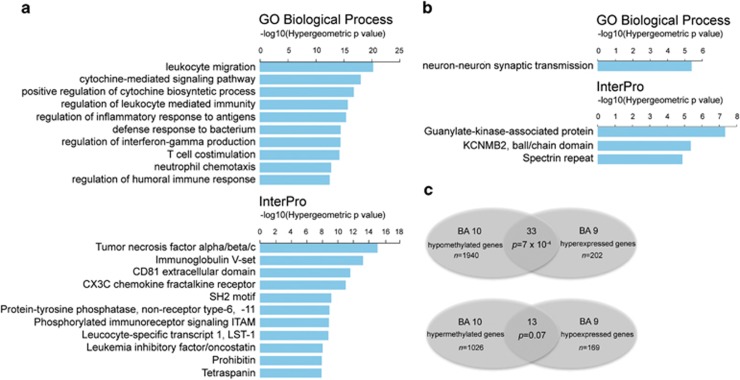
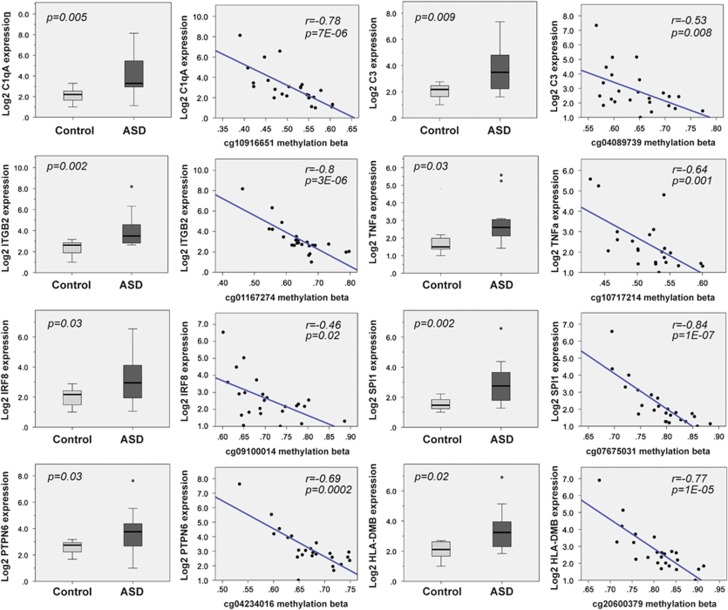
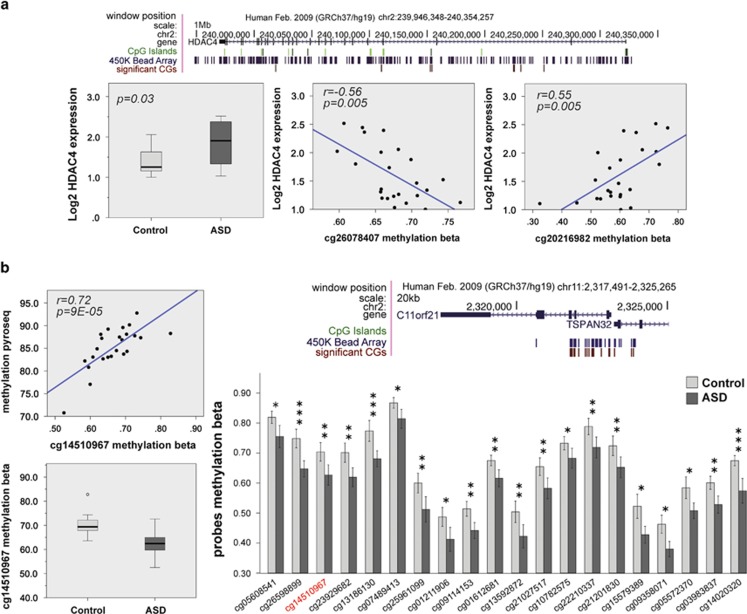
Autism spectrum disorders (ASD) are a group of neurodevelopmental conditions characterized by dysfunction in social interaction, communication and stereotypic behavior. Genetic and environmental factors have been implicated in the development of ASD, but the molecular mechanisms underlying their interaction are not clear. Epigenetic modifications have been suggested as molecular mechanism that can mediate the interaction between the environment and the genome to produce adaptive or maladaptive behaviors. Here, using the Illumina 450 K methylation array we have determined the existence of many dysregulated CpGs in two cortical regions, Brodmann area 10 (BA10) and Brodmann area 24 (BA24), of individuals who had ASD. In BA10 we found a very significant enrichment for genomic areas responsible for immune functions among the hypomethylated CpGs, whereas genes related to synaptic membrane were enriched among hypermethylated CpGs. By comparing our methylome data with previously published transcriptome data, and by performing real-time PCR on selected genes that were dysregulated in our study, we show that hypomethylated genes are often overexpressed, and that there is an inverse correlation between gene expression and DNA methylation within the individuals. Among these genes there were C1Q, C3, ITGB2 (C3R), TNF-α, IRF8 and SPI1, which have recently been implicated in synaptic pruning and microglial cell specification. Finally, we determined the epigenetic dysregulation of the gene HDAC4, and we confirm that the locus encompassing C11orf21/TSPAN32 has multiple hypomethylated CpGs in the autistic brain, as previously demonstrated. Our data suggest a possible role for epigenetic processes in the etiology of ASD.
Figures
Similar articles
-
Epigenetic dysregulation of SHANK3 in brain tissues from individuals with autism spectrum disorders.Hum Mol Genet. 2014 Mar 15;23(6):1563-78. doi: 10.1093/hmg/ddt547. Epub 2013 Nov 1. Hum Mol Genet. 2014. PMID: 24186872 Free PMC article.
-
Mosaic epigenetic dysregulation of ectodermal cells in autism spectrum disorder.PLoS Genet. 2014 May 29;10(5):e1004402. doi: 10.1371/journal.pgen.1004402. eCollection 2014. PLoS Genet. 2014. PMID: 24875834 Free PMC article.
-
Integrated genetic and methylomic analyses identify shared biology between autism and autistic traits.Mol Autism. 2019 Jul 17;10:31. doi: 10.1186/s13229-019-0279-z. eCollection 2019. Mol Autism. 2019. PMID: 31346403 Free PMC article.
-
[Epigenetics' implication in autism spectrum disorders: A review].Encephale. 2017 Aug;43(4):374-381. doi: 10.1016/j.encep.2016.07.007. Epub 2016 Sep 28. Encephale. 2017. PMID: 27692350 Review. French.
-
From genes to environment: using integrative genomics to build a "systems-level" understanding of autism spectrum disorders.Child Dev. 2013 Jan-Feb;84(1):89-103. doi: 10.1111/j.1467-8624.2012.01759.x. Epub 2012 Apr 12. Child Dev. 2013. PMID: 22497667 Free PMC article. Review.
Cited by
-
Cord blood DNA methylome in newborns later diagnosed with autism spectrum disorder reflects early dysregulation of neurodevelopmental and X-linked genes.Genome Med. 2020 Oct 14;12(1):88. doi: 10.1186/s13073-020-00785-8. Genome Med. 2020. PMID: 33054850 Free PMC article.
-
Integrated genome-wide Alu methylation and transcriptome profiling analyses reveal novel epigenetic regulatory networks associated with autism spectrum disorder.Mol Autism. 2018 Apr 16;9:27. doi: 10.1186/s13229-018-0213-9. eCollection 2018. Mol Autism. 2018. PMID: 29686828 Free PMC article.
-
Multifactorial Origin of Neurodevelopmental Disorders: Approaches to Understanding Complex Etiologies.Toxics. 2015 Mar 23;3(1):89-129. doi: 10.3390/toxics3010089. Toxics. 2015. PMID: 29056653 Free PMC article. Review.
-
Integrative genomic analyses for identification and prioritization of long non-coding RNAs associated with autism.PLoS One. 2017 May 31;12(5):e0178532. doi: 10.1371/journal.pone.0178532. eCollection 2017. PLoS One. 2017. PMID: 28562671 Free PMC article.
-
Arachidonic and oleic acid exert distinct effects on the DNA methylome.Epigenetics. 2016 May 3;11(5):321-34. doi: 10.1080/15592294.2016.1161873. Epub 2016 Apr 18. Epigenetics. 2016. PMID: 27088456 Free PMC article.
References
-
- American Psychiatric Association. Diagnostic and Statistical Manual of Mental Disorders: DSM-5TM (5th edn), 2013
-
- Ronald A, Hoekstra RA. Autism spectrum disorders and autistic traits: a decade of new twin studies. Am J Med Genet B Neuropsychiatr Genet. 2011;156B:255–274. - PubMed
Publication types
MeSH terms
LinkOut - more resources
Full Text Sources
Other Literature Sources
Molecular Biology Databases
Miscellaneous
