

FHL2 regulates hematopoietic stem cell functions under stress conditions
- PMID: 25179730
- PMCID: PMC4346553
- DOI: 10.1038/leu.2014.254
FHL2 regulates hematopoietic stem cell functions under stress conditions
Abstract
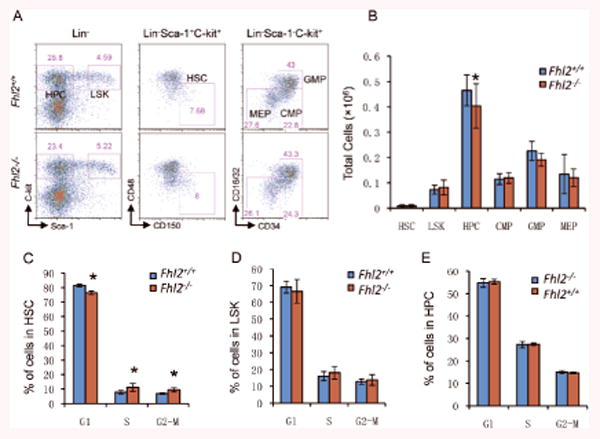
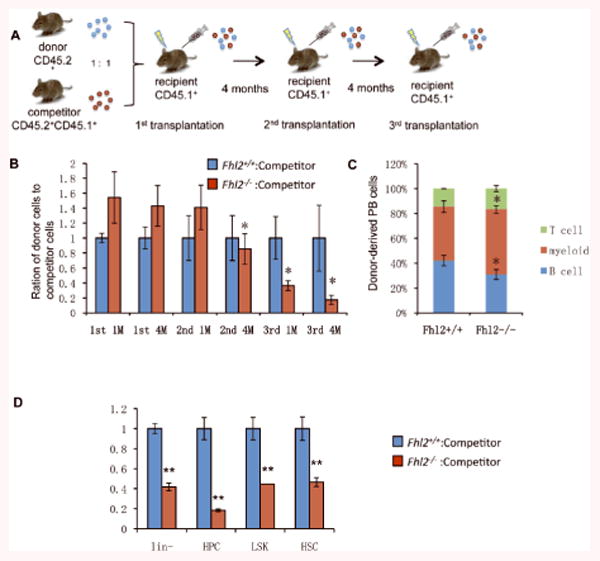
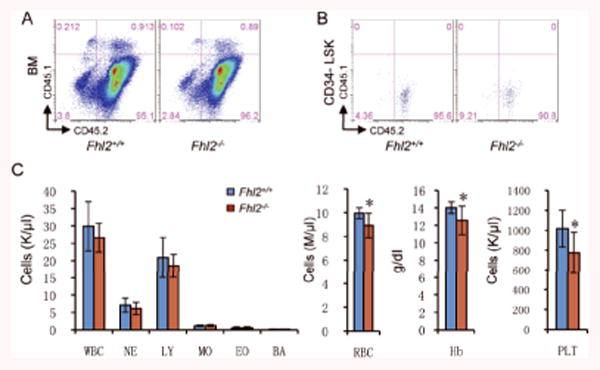
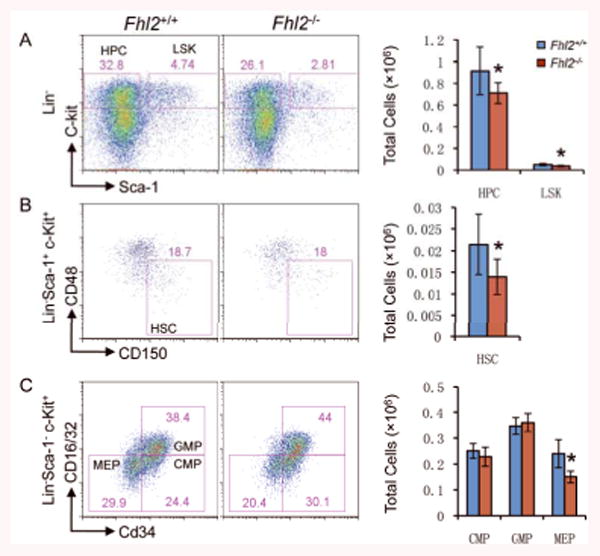
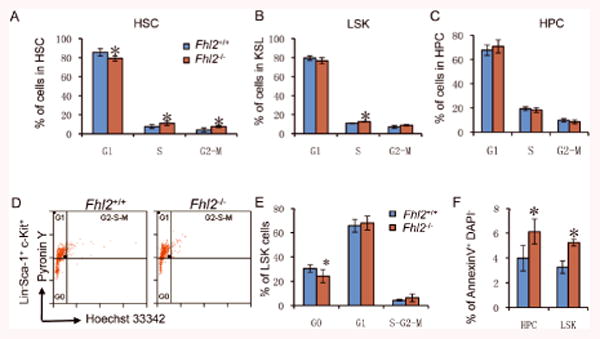
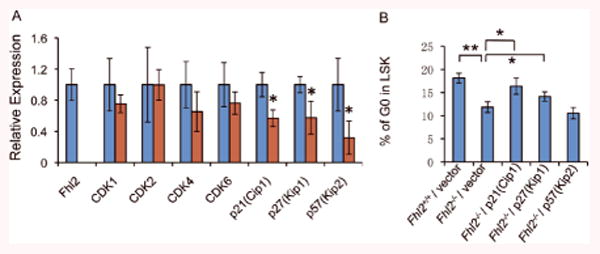
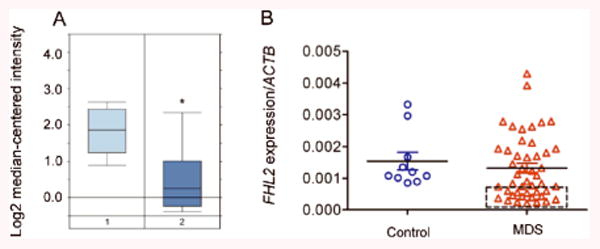
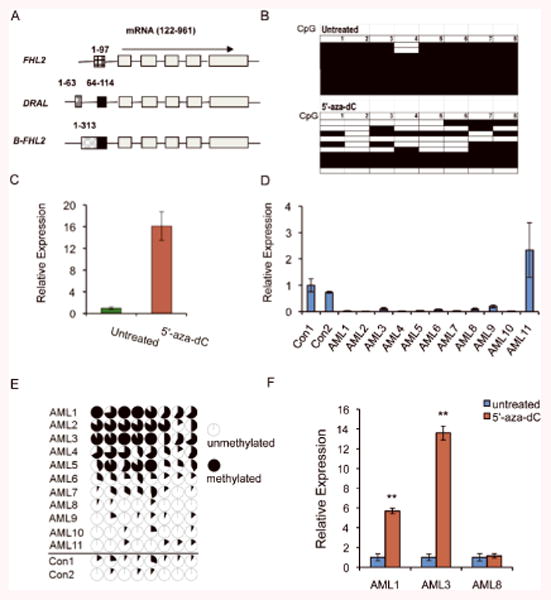
FHL2, a member of the four and one half LIM domain protein family, is a critical transcriptional modulator. Here, we identify FHL2 as a critical regulator of hematopoietic stem cells (HSCs) that is essential for maintaining HSC self-renewal under regenerative stress. We find that Fhl2 loss has limited effects on hematopoiesis under homeostatic conditions. In contrast, Fhl2-null chimeric mice reconstituted with Fhl2-null bone marrow cells developed abnormal hematopoiesis with significantly reduced numbers of HSCs, hematopoietic progenitor cells (HPCs), red blood cells and platelets as well as hemoglobin levels. In addition, HSCs displayed a significantly reduced self-renewal capacity and were skewed toward myeloid lineage differentiation. We find that Fhl2 loss reduces both HSC quiescence and survival in response to regenerative stress, probably as a consequence of Fhl2-loss-mediated downregulation of cyclin-dependent kinase-inhibitors, including p21(Cip) and p27(Kip1). Interestingly, FHL2 is regulated under the control of a tissue-specific promoter in hematopoietic cells and it is downregulated by DNA hypermethylation in the leukemia cell line and primary leukemia cells. Furthermore, we find that downregulation of FHL2 frequently occurs in myelodysplastic syndrome and acute myeloid leukemia patients, raising a possibility that FHL2 downregulation has a role in the pathogenesis of myeloid malignancies.
Figures
Similar articles
-
FHL2 interacts with iASPP and impacts the biological functions of leukemia cells.Oncotarget. 2017 Jun 20;8(25):40885-40895. doi: 10.18632/oncotarget.16617. Oncotarget. 2017. PMID: 28402264 Free PMC article.
-
Deletion of FHL2 gene impaired ischemia-induced blood flow recovery by modulating circulating proangiogenic cells.Arterioscler Thromb Vasc Biol. 2013 Apr;33(4):709-17. doi: 10.1161/ATVBAHA.112.300318. Epub 2013 Feb 14. Arterioscler Thromb Vasc Biol. 2013. PMID: 23413425
-
Enhanced expression of FHL2 leads to abnormal myelopoiesis in vivo.Leukemia. 2009 Sep;23(9):1650-7. doi: 10.1038/leu.2009.78. Epub 2009 Apr 16. Leukemia. 2009. PMID: 19369964
-
The role of FHL2 in wound healing and inflammation.FASEB J. 2019 Jul;33(7):7799-7809. doi: 10.1096/fj.201802765RR. Epub 2019 Apr 2. FASEB J. 2019. PMID: 30939249 Review.
-
The roles of FHL2 in cancer.Clin Exp Med. 2023 Nov;23(7):3113-3124. doi: 10.1007/s10238-023-01076-3. Epub 2023 Apr 27. Clin Exp Med. 2023. PMID: 37103649 Review.
Cited by
-
Exposure to Polycyclic Aromatic Hydrocarbons and Accelerated DNA Methylation Aging.Environ Health Perspect. 2018 Jun 14;126(6):067005. doi: 10.1289/EHP2773. eCollection 2018 Jun. Environ Health Perspect. 2018. PMID: 29906262 Free PMC article.
-
High FHL2 mRNA expression and its prognostic value in lung cancer.Aging (Albany NY). 2022 Oct 10;14(19):7986-8000. doi: 10.18632/aging.204328. Epub 2022 Oct 10. Aging (Albany NY). 2022. PMID: 36227138 Free PMC article.
-
Targeting FHL2-E-cadherin axis by miR-340-5p attenuates colon cancer cell migration and invasion.Oncol Lett. 2021 Aug;22(2):637. doi: 10.3892/ol.2021.12898. Epub 2021 Jul 3. Oncol Lett. 2021. PMID: 34295384 Free PMC article.
-
Impact of Treadmill Interval Running on the Appearance of Zinc Finger Protein FHL2 in Bone Marrow Cells in a Rat Model: A Pilot Study.Life (Basel). 2022 Apr 2;12(4):528. doi: 10.3390/life12040528. Life (Basel). 2022. PMID: 35455019 Free PMC article.
-
Molecular regulation of hematopoietic stem cell quiescence.Cell Mol Life Sci. 2022 Mar 31;79(4):218. doi: 10.1007/s00018-022-04200-w. Cell Mol Life Sci. 2022. PMID: 35357574 Free PMC article. Review.
References
-
- Genini M, Schwalbe P, Scholl FA, Remppis A, Mattei MG, Schafer BW. Subtractive cloning and characterization of DRAL, a novel LIM-domain protein down-regulated in rhabdomyosarcoma. DNA Cell Biol. 1997;16:433–442. - PubMed
-
- Chu PH, Ruiz-Lozano P, Zhou Q, Cai C, Chen J. Expression patterns of FHL/SLIM family members suggest important functional roles in skeletal muscle and cardiovascular system. Mech Dev. 2000;95:259–265. - PubMed
-
- Morgan MJ, Madgwick AJ. The fourth member of the FHL family of LIM proteins is expressed exclusively in the testis. Biochem Biophys Res Commun. 1999;255:251–255. - PubMed
-
- Morgan MJ, Madgwick AJ. The LIM proteins FHL1 and FHL3 are expressed differently in skeletal muscle. Biochem Biophys Res Commun. 1999;255:245–250. - PubMed
Publication types
MeSH terms
Substances
Grants and funding
LinkOut - more resources
Full Text Sources
Other Literature Sources
Medical
Molecular Biology Databases
Miscellaneous
