

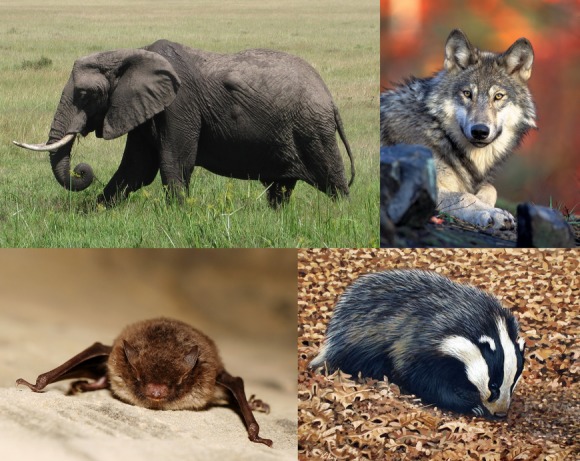
Establishing macroecological trait datasets: digitalization, extrapolation, and validation of diet preferences in terrestrial mammals worldwide
- PMID: 25165528
- PMCID: PMC4130448
- DOI: 10.1002/ece3.1136
Establishing macroecological trait datasets: digitalization, extrapolation, and validation of diet preferences in terrestrial mammals worldwide
Abstract
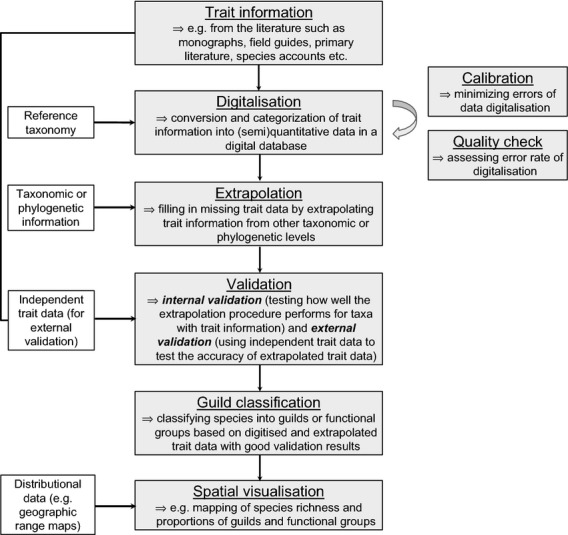
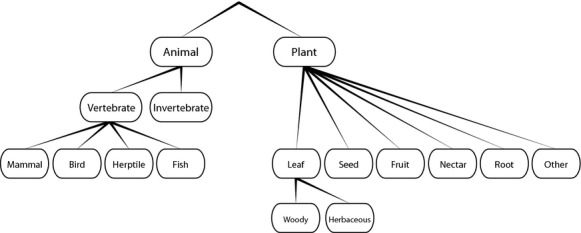
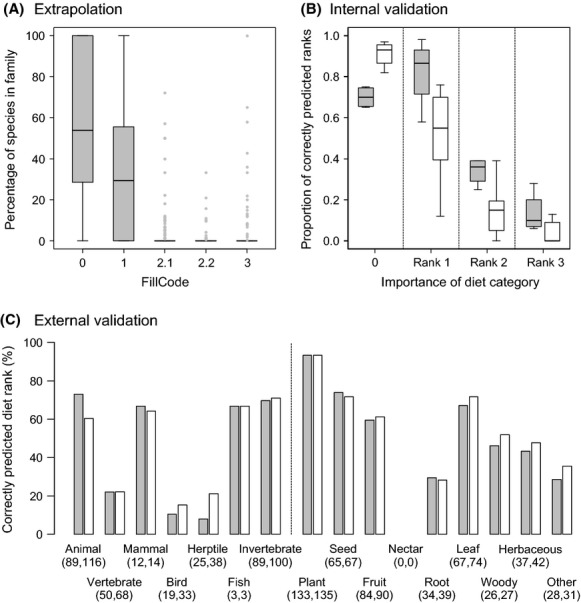
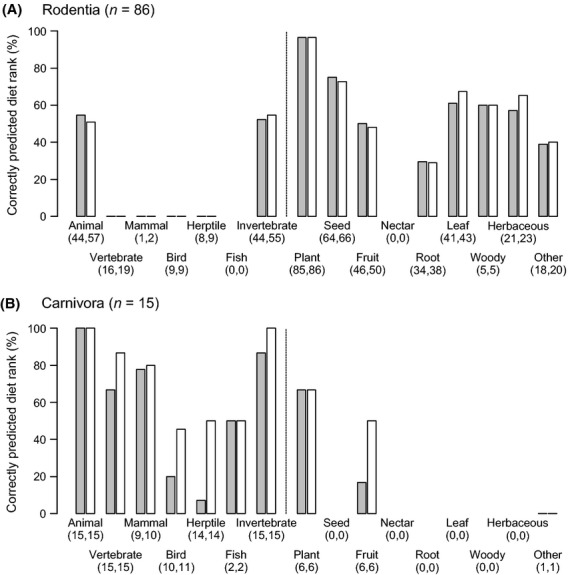
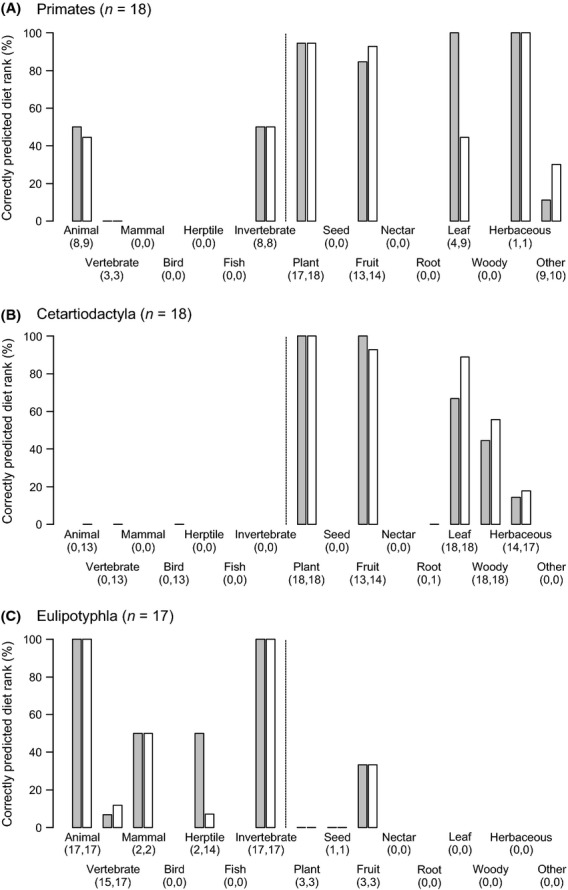
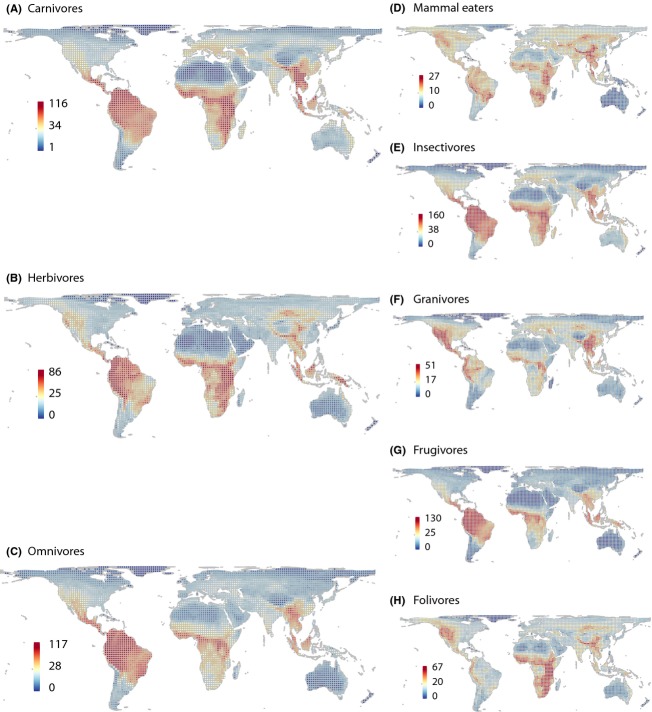
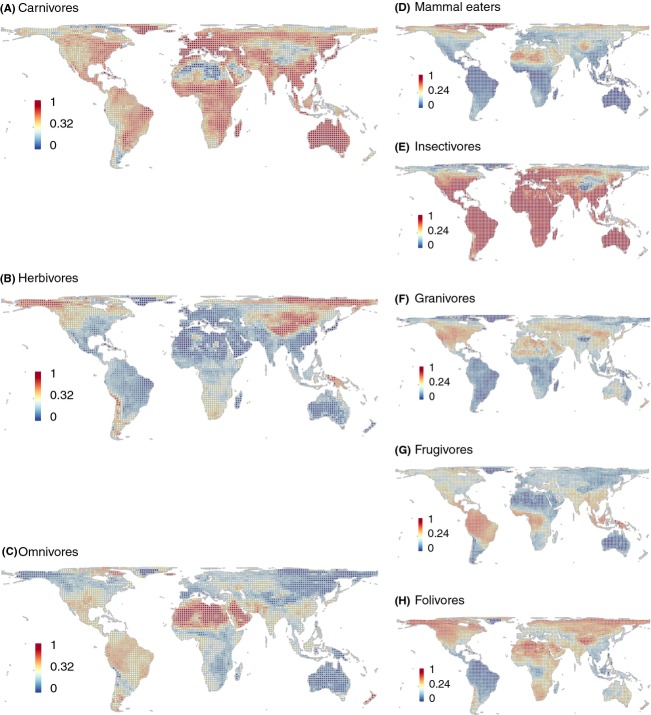
Ecological trait data are essential for understanding the broad-scale distribution of biodiversity and its response to global change. For animals, diet represents a fundamental aspect of species' evolutionary adaptations, ecological and functional roles, and trophic interactions. However, the importance of diet for macroevolutionary and macroecological dynamics remains little explored, partly because of the lack of comprehensive trait datasets. We compiled and evaluated a comprehensive global dataset of diet preferences of mammals ("MammalDIET"). Diet information was digitized from two global and cladewide data sources and errors of data entry by multiple data recorders were assessed. We then developed a hierarchical extrapolation procedure to fill-in diet information for species with missing information. Missing data were extrapolated with information from other taxonomic levels (genus, other species within the same genus, or family) and this extrapolation was subsequently validated both internally (with a jack-knife approach applied to the compiled species-level diet data) and externally (using independent species-level diet information from a comprehensive continentwide data source). Finally, we grouped mammal species into trophic levels and dietary guilds, and their species richness as well as their proportion of total richness were mapped at a global scale for those diet categories with good validation results. The success rate of correctly digitizing data was 94%, indicating that the consistency in data entry among multiple recorders was high. Data sources provided species-level diet information for a total of 2033 species (38% of all 5364 terrestrial mammal species, based on the IUCN taxonomy). For the remaining 3331 species, diet information was mostly extrapolated from genus-level diet information (48% of all terrestrial mammal species), and only rarely from other species within the same genus (6%) or from family level (8%). Internal and external validation showed that: (1) extrapolations were most reliable for primary food items; (2) several diet categories ("Animal", "Mammal", "Invertebrate", "Plant", "Seed", "Fruit", and "Leaf") had high proportions of correctly predicted diet ranks; and (3) the potential of correctly extrapolating specific diet categories varied both within and among clades. Global maps of species richness and proportion showed congruence among trophic levels, but also substantial discrepancies between dietary guilds. MammalDIET provides a comprehensive, unique and freely available dataset on diet preferences for all terrestrial mammals worldwide. It enables broad-scale analyses for specific trophic levels and dietary guilds, and a first assessment of trait conservatism in mammalian diet preferences at a global scale. The digitalization, extrapolation and validation procedures could be transferable to other trait data and taxa.
Keywords: Diet ecology; Mammalia; ecological trait data; feeding guild; phylogenetic conservatism; trophic structure.
Figures
Similar articles
-
COMBINE: a coalesced mammal database of intrinsic and extrinsic traits.Ecology. 2021 Jun;102(6):e03344. doi: 10.1002/ecy.3344. Epub 2021 May 16. Ecology. 2021. PMID: 33742448
-
Mammal predator and prey species richness are strongly linked at macroscales.Ecology. 2013 May;94(5):1112-22. doi: 10.1890/12-1342.1. Ecology. 2013. PMID: 23858651
-
ATLANTIC-CAMTRAPS: a dataset of medium and large terrestrial mammal communities in the Atlantic Forest of South America.Ecology. 2017 Nov;98(11):2979. doi: 10.1002/ecy.1998. Ecology. 2017. PMID: 28857166
-
Fig-eating by vertebrate frugivores: a global review.Biol Rev Camb Philos Soc. 2001 Nov;76(4):529-72. doi: 10.1017/s1464793101005760. Biol Rev Camb Philos Soc. 2001. PMID: 11762492 Review.
-
Building essential biodiversity variables (EBVs) of species distribution and abundance at a global scale.Biol Rev Camb Philos Soc. 2018 Feb;93(1):600-625. doi: 10.1111/brv.12359. Epub 2017 Aug 2. Biol Rev Camb Philos Soc. 2018. PMID: 28766908 Review.
Cited by
-
Metabarcoding of fecal DNA reveals the broad and flexible diet of a globally endangered bird.Curr Zool. 2022 Sep 8;69(5):501-513. doi: 10.1093/cz/zoac071. eCollection 2023 Oct. Curr Zool. 2022. PMID: 37637316 Free PMC article.
-
Heterogeneous distributional responses to climate warming: evidence from rodents along a subtropical elevational gradient.BMC Ecol. 2017 Apr 20;17(1):17. doi: 10.1186/s12898-017-0128-x. BMC Ecol. 2017. PMID: 28427386 Free PMC article.
-
Diversity and evolution of the vertebrate chemoreceptor gene repertoire.Nat Commun. 2024 Feb 15;15(1):1421. doi: 10.1038/s41467-024-45500-y. Nat Commun. 2024. PMID: 38360851 Free PMC article.
-
Matrix condition mediates the effects of habitat fragmentation on species extinction risk.Nat Commun. 2022 Feb 1;13(1):595. doi: 10.1038/s41467-022-28270-3. Nat Commun. 2022. PMID: 35105881 Free PMC article.
-
Cancer hygiene hypothesis: A test from wild captive mammals.Ecol Evol. 2023 Sep 22;13(9):e10547. doi: 10.1002/ece3.10547. eCollection 2023 Sep. Ecol Evol. 2023. PMID: 37745791 Free PMC article.
References
-
- Angelone C. Evolutionary trends in dental morphology of the genus Prolagus (Ochotonidae, Lagomorpha) in the Mediterranean islands. In: Alcover JA, Bover P, editors. Proceedings of the international symposium “insular vertebrate evolution: the palaeontological approach”. Palma de Mallorca: Monografies de la Societat d'Història Natural de les Balears; 2005. pp. 17–26.
-
- Barnagaud JY, Kissling WD, Sandel B, Eiserhardt WL, Sekercioglu CH, Enquist BJ, et al. Ecological traits influence the phylogenetic structure of bird species co-occurrences worldwide. Ecol. Lett. 2014 doi: 10.1111/ele.12285. - DOI - PubMed
-
- Bininda-Emonds ORP, Cardillo M, Jones KE, Macphee RDE, Beck RMD, Grenyer R, et al. The delayed rise of present-day mammals. Nature. 2008;456:507–512. - PubMed
-
- BirdLife International & NatureServe. Bird species distribution maps of the world. Cambridge, U.K., and Arlington, TX: BirdLife International and NatureServe; 2011.
-
- Brown JH, Maurer BA. Macroecology - the division of food and space among species on continents. Science. 1989;243:1145–1150. - PubMed
Grants and funding
LinkOut - more resources
Full Text Sources
Other Literature Sources
