. 2014 Aug 27;34(35):11705-22.
doi: 10.1523/JNEUROSCI.0175-14.2014.

A model of the medial superior olive explains spatiotemporal features of local field potentials

Affiliations

A model of the medial superior olive explains spatiotemporal features of local field potentials

Joshua H Goldwyn et al. J Neurosci. .

Abstract

Local field potentials are important indicators of in vivo neural activity. Sustained, phase-locked, sound-evoked extracellular fields in the mammalian auditory brainstem, known as the auditory neurophonic, reflect the activity of neurons in the medial superior olive (MSO). We develop a biophysically based model of the neurophonic that accounts for features of in vivo extracellular recordings in the cat auditory brainstem. By making plausible idealizations regarding the spatial symmetry of MSO neurons and the temporal synchrony of their afferent inputs, we reduce the challenging problem of computing extracellular potentials in a 3D volume conductor to a one-dimensional problem. We find that postsynaptic currents in bipolar MSO neuron models generate extracellular voltage responses that strikingly resemble in vivo recordings. Simulations reproduce distinctive spatiotemporal features of the in vivo neurophonic response to monaural pure tones: large oscillations (hundreds of microvolts to millivolts), broad spatial reach (millimeter scale), and a dipole-like spatial profile. We also explain how somatic inhibition and the relative timing of bilateral excitation may shape the spatial profile of the neurophonic. We observe in simulations, and find supporting evidence in in vivo data, that coincident excitatory inputs on both dendrites lead to a drastically reduced spatial reach of the neurophonic. This outcome surprises because coincident inputs are thought to evoke maximal firing rates in MSO neurons, and it reconciles previously puzzling evoked potential results in humans and animals. The success of our model, which has no axon or spike-generating sodium currents, suggests that MSO spikes do not contribute appreciably to the neurophonic.

Keywords: auditory brainstem; computer model; local field potential; medial superior olive; neurophonic.


Figures

Figure 1.
Figure 1.
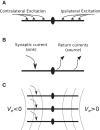
The dipole theory of the neurophonic. A, Schematic of excitatory inputs to principal cells of the MSO. Excitatory inputs largely target the dendrites, and inputs from the two ears are segregated on opposite dendrites. B, The arrangement of excitatory inputs and bipolar morphology suggest that monaural inputs to MSO neurons will act as a current dipole: excitatory currents are sinks and compensatory outward currents are sources. C, An idealized representation of a local subpopulation of MSO neurons. The gray lines indicate isopotential Ve field lines of the dipole-like field that would be generated by a local subpopulation receiving monolateral excitatory input and satisfying the symmetry and synchrony assumptions described in the text.
Figure 2.
Figure 2.
Model of the neurophonic based on symmetry and synchrony assumptions. A, Small population of MSO neurons after injection of a retrograde tracer (BDA) in the inferior colliculus (gerbil, courtesy of Dr. T. Franken). The section is coronal: lateral is to the left, medial to the right, dorsal is up, ventral is down. The bipolar morphology, with dendrites extending medially and laterally, and the stacking of cell bodies along a dorsoventral axis, are clearly visible. B, An idealized subpopulation of MSO neurons with identical bipolar dendrites and symmetric spatial arrangement. We assume synaptic inputs to all cells are identical, so it suffices to compute Vm in one representative neuron and the Ve field in a surrounding “virtual cylinder” of extracellular space. C, Vm of representative neuron and Ve in the virtual cylinder are computed using the compartmental method. In each Δx segment, the intracellular and extracellular voltages, Vi and Ve, are dynamically coupled via transmembrane currents (green arrow), which themselves are functions of the membrane potential (Vm = ViVe). Blue and red arrows indicate extracellular and intracellular currents, respectively.
Figure 3.
Figure 3.
In vivo neurophonic response to 1200 Hz monaural tone. Top row, Response to contralateral stimuli recorded at two depths in the brainstem. Each trace is a brief portion of a longer recording; these data are not averaged. Larger depth (blue) indicates more dorsolateral recording position. Bottom row, Comparison of responses to contralateral (blue) and ipsilateral (red) tones at 3900 μm recording depth. A, Onset responses include a slow-wave potential. B, Ongoing responses oscillate around 0 mV because of 10 Hz high pass filter in the data acquisition system. Oscillations in the neurophonic match the stimulus frequency (1200 Hz).
Figure 4.
Figure 4.
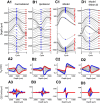
Response of the model to 1 kHz monolateral excitatory inputs. A, Spatiotemporal profile of membrane potential. The ordinate represents the mediolateral or dendritic distance in micrometers, with 0 representing the soma. The abscissa is the time axis; it begins at 4 ms to show only the ongoing response (after transient effects caused by the initial resting state of the neuron model have disappeared). The black icon at left represents the dimensions of the neuron model. The resting membrane potential is −60 mV. B, Spatiotemporal profile of the simulated neurophonic; note the change in scale on the ordinate from A. C, Spatiotemporal profile of the simulated neurophonic with mean value removed from every spatial location. This mimics the 10 Hz high pass filter imposed by data acquisition system in experiments of Mc Laughlin et al. (2010). D, Spatiotemporal profile of membrane current. E, Spatiotemporal profile of membrane current excluding synaptic current. Note the difference in color scale in D and E. F, Synaptic current (black) and sum of membrane currents in the three regions of the neuron model (colors): near dendrite (side with synaptic input), soma, and far dendrite (side opposite to synaptic input).
Figure 5.
Figure 5.
Comparison of neurophonic response to 1200 Hz monaural pure tones (contralateral and ipsilateral) and monolateral input trains (model). Data are from the same recording sessions as those in Figure 3. Top row, Cycle-averaged neurophonic responses plotted over one cycle at each recording depth. The vertical position of each trace is determined by its mean value and by a 0.04 mV offset between adjacent traces for clarity of presentation. Bottom row, Spatial profile of cycle-averaged neurophonic responses. The blue and red dots in the top panels form the blue and red spatial profiles in the bottom panels. A, In vivo neurophonic response to contralateral tone. B, In vivo neurophonic response to ipsilateral tone. C, Simulated neurophonic response for excitation on dendrite at negative depth. One cycle of the ongoing response (after transient effects caused by the initial resting state of the neuron model have disappeared). D, Same as in C with mean value removed at each spatial location to mimic the effect of the 10 Hz high pass filter imposed by the data acquisition system in experiments.
Figure 6.
Figure 6.
Spatial profile of simulated neurophonic response to 1200 Hz monaural pure tones using asymmetric extracellular resistivity. For these simulations only, extracellular resistivity between the end of the far dendrite (positive depth) and electric ground is half the value as the resistivity between the near dendrite (negative depth) and electric ground. A, Simulated neurophonic response for excitation on dendrite at negative depth. One cycle of the ongoing response (after transient effects caused by the initial resting state of the neuron model have disappeared). B, Same as in A with mean value removed at each spatial location. A is same format as Figure 5C2 and B is same format as Figure 5D2.
Figure 7.
Figure 7.
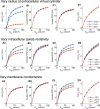
Effect of peak synaptic conductance and virtual cylinder radius on amplitude of the simulated neurophonic. Abscissa in all panels is value of Gsyn parameter in Equation 14. A, Maximum amplitude of Ve in response to a single monolateral excitatory synaptic event. B, Maximum amplitude of EPSP measured in the dendrite that received synaptic input. C, Maximum amplitude of EPSP measured in the soma of the neuron model. D, Maximum amplitude of excitatory synaptic current. Excitatory current (an inward current) is considered negative by convention, but here we plot its amplitude as a positive value. Colored lines indicate the radius of the virtual cylinder. In all panels, maxima are computed over all spatial locations. Simulation results presented in other figures use Gsyn = 10 mS/cm2 and virtual cylinder radius 11 μm, unless noted otherwise.
Figure 8.
Figure 8.
Maximum amplitude of oscillations in the neurophonic response to monaural pure tones (data) and monolateral trains of excitation (model). Maximum amplitude of oscillations is calculated as the maximum (over all recording depths) of the peak-to-trough change in voltage in one cycle of the cycle-averaged neurophonic response. In vivo neurophonic responses to contralateral (circles) and ipsilateral (triangles) tones compared with simulated neurophonic responses. In the “control” case of the model (black line), synaptic inputs have τsyn = 0.2 ms and peak conductance Gsyn = 10 mS/cm2. Fast synaptic kinetics (blue) have τsyn = 0.1 ms. Slow synaptic kinetics (green) have τsyn = 0.35 ms, and peak conductance is tripled to maintain the amplitude of the response at 1 kHz. Red line indicates simulated neurophonic response when the low-threshold K+ conductance is “frozen” at its value for resting membrane potential.
Figure 9.
Figure 9.
Response of the model to 1 kHz bilateral excitatory inputs. Row A, Excitatory inputs arrive out of phase on the two dendrites (0.5 ms time difference). Row B, Excitatory inputs arrive in phase on the two dendrites (coincident inputs). A1, B1, Spatiotemporal profile of membrane potential. The ordinate represents the mediolateral or dendritic distance in micrometers, with 0 representing the soma. The abscissa is the time axis; it begins at 4 ms to show only the ongoing response. The black icon at left represents the dimensions of the neuron model. A2, B2, Spatiotemporal profile of the simulated neurophonic; note the change in scale on the ordinate from left column. A3, B3, Spatiotemporal profile of the simulated neurophonic with mean value removed from every spatial location. This mimics the 10 Hz high pass filter imposed by data acquisition system in experiments of Mc Laughlin et al. (2010).
Figure 10.
Figure 10.
Comparison of neurophonic response to 1200/1201 Hz binaural beat (A–C) and bilateral input trains (D,E). Top row, Cycle-averaged neurophonic responses plotted over one cycle at each recording depth. The vertical position of each trace is determined by its mean value and by a 0.08 mV offset between adjacent traces for clarity of presentation. Bottom row, Spatial profile of cycle-averaged neurophonic responses. The blue and red dots in the top panels form the blue and red spatial profiles in the bottom panels. Cycle-averaging was performed over a 50 ms time window. A, In vivo neurophonic response at t = 430 ms after stimulus onset. B, In vivo neurophonic response at t = 930 ms (half of the beat cycle after A). C, In vivo neurophonic response at t = 1.43 s (one beat cycle after A). D, Simulated neurophonic response for out-of-phase bilateral excitation. E, Simulated neurophonic response for in-phase bilateral excitation. Simulation results have been “filtered” by removing the mean (over time) at each spatial location to mimic the 10 Hz high pass filter of the in vivo data. A, C, Experimental data resemble simulations in D. B, Experimental data resemble simulations in E.
Figure 11.
Figure 11.
Comparison of summed monaural neurophonic responses. Figure format is the same as in Figure 10. A–C, In vivo data are sum of response to 1200 Hz contralateral tone and 1201 Hz tone in ipsilateral ear. D, E, Simulations are sum of monolateral responses to 1200 and 1201 Hz input trains. Similarity between these figures and Figure 10 shows neurophonic responses to binaural stimuli resemble the sum of responses to corresponding monaural stimuli.
Figure 12.
Figure 12.
Response of the model to 1 kHz monolateral excitatory inputs with somatic inhibition. Inhibitory events precede excitatory events by 0.35 ms. Peak synaptic conductance is 10 mS/cm2 for excitation and 4 mS/cm2 for inhibition. A, Spatiotemporal profile of membrane potential. The ordinate represents the mediolateral or dendritic distance in micrometers, with 0 representing the soma. The abscissa is the time axis; it begins at 4 ms to show only the ongoing response. The black icon at left represents the dimensions of the neuron model. The resting membrane potential is −60 mV. B, Spatiotemporal profile of the simulated neurophonic; note the change in scale on the ordinate from A. The dashed black line at t = 6.3 ms indicates the time at which the spatial cross-sections in Figure 13 are taken. C, Spatiotemporal profile of the simulated neurophonic with mean value removed from every spatial location. This mimics the 10 Hz high pass filter imposed by data acquisition system in experiments of Mc Laughlin et al. (2010). D, Difference of simulated neurophonic responses with and without inhibition (i.e., the difference between Figs. 12C and 4C).
Figure 13.
Figure 13.
Contribution of inhibition to Ve field and membrane current. A, Spatial profile of Ve field at t = 6.3 ms (cross-section indicated by black line in Fig. 12B). Inhibition alone produces local increase in Ve (blue). Interplay of inhibition and excitation (black) increases Ve field more than the linear sum of inhibition alone and excitation alone (green). B, Membrane current in the near dendrite (side receiving excitatory input). Interplay of inhibition and excitation generates a larger sink (more negative membrane current) in the near dendrite (black) than the linear sum of membrane currents produced in the near dendrite by excitation alone and inhibition alone (green). Parameters are the same as in Figure 12.

Similar articles

Cited by

References

    1. Ashida G, Funabiki K, Carr CE. Biophysical basis of the sound analog membrane potential that underlies coincidence detection in the barn owl. Front Comput Neurosci. 2013;7:102. doi: 10.3389/fncom.2013.00102. - DOI - PMC - PubMed
    1. Baumann VJ, Lehnert S, Leibold C, Koch U. Tonotopic organization of the hyperpolarization-activated current (Ih) in the mammalian medial superior olive. Front Neural Circuits. 2013;7:117. doi: 10.3389/fncir.2013.00117. - DOI - PMC - PubMed
    1. Biedenbach MA, Freeman WJ. Click-evoked potential map from the superior olivary nucleus. Am J Physiol. 1964;206:1408–1414. - PubMed
    1. Blackburn CC, Sachs MB. Classification of unit types in the anteroventral cochlear nucleus: PST histograms and regularity analysis. J Neurophysiol. 1989;62:1303–1329. - PubMed
    1. Boudreau JC. Neural volleying: upper frequency limits detectable in the auditory system. Nature. 1965;208:1237–1238. doi: 10.1038/2081237a0. - DOI - PubMed

Publication types

LinkOut - more resources