STAT3 supports experimental K-RasG12D-induced murine myeloproliferative neoplasms dependent on serine phosphorylation
- PMID: 25150294
- PMCID: PMC4183984
- DOI: 10.1182/blood-2013-02-484196
STAT3 supports experimental K-RasG12D-induced murine myeloproliferative neoplasms dependent on serine phosphorylation
Abstract
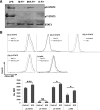
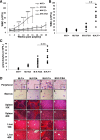
Juvenile myelomonocytic leukemia, acute myeloid leukemia (AML), and other myeloproliferative neoplasms (MPNs) are genetically heterogeneous but frequently display activating mutations in Ras GTPases and activation of signal transducer and activator of transcription 3 (STAT3). Altered STAT3 activity is observed in up to 50% of AML correlating with poor prognosis. Activated STAT proteins, classically associated with tyrosine phosphorylation, support tumor development as transcription factors, but alternative STAT functions independent of tyrosine phosphorylation have been documented, including roles for serine-phosphorylated STAT3 in mitochondria supporting transformation by oncogenic Ras. We examined requirements for STAT3 in experimental murine K-Ras-dependent hematopoietic neoplasia. We show that STAT3 is phosphorylated on S727 but not Y705 in diseased animals. Moreover, a mouse with a point mutation abrogating STAT3 S727 phosphorylation displayed delayed onset and decreased disease severity with significantly extended survival. Activated K-Ras required STAT3 for cytokine-independent growth of myeloid progenitors in vitro, and mitochondrially restricted STAT3 and STAT3-Y705F, both transcriptionally inert mutants, supported factor-independent growth. STAT3 was dispensable for growth of normal or K-Ras-mutant myeloid progenitors in response to cytokines. However, abrogation of STAT3-S727 phosphorylation impaired factor-independent malignant growth. These data document that serine-phosphorylated mitochondrial STAT3 supports neoplastic hematopoietic cell growth induced by K-Ras.
© 2014 by The American Society of Hematology.
Figures


Similar articles
-
Activation of signal transducer and activator of transcription 3 through a phosphomimetic serine 727 promotes prostate tumorigenesis independent of tyrosine 705 phosphorylation.Cancer Res. 2008 Oct 1;68(19):7736-41. doi: 10.1158/0008-5472.CAN-08-1125. Cancer Res. 2008. PMID: 18829527 Free PMC article.
-
The MEK-ERK pathway is necessary for serine phosphorylation of mitochondrial STAT3 and Ras-mediated transformation.PLoS One. 2013 Nov 29;8(11):e83395. doi: 10.1371/journal.pone.0083395. eCollection 2013. PLoS One. 2013. PMID: 24312439 Free PMC article.
-
Mitochondrial STAT3 supports Ras-dependent oncogenic transformation.Science. 2009 Jun 26;324(5935):1713-6. doi: 10.1126/science.1171721. Science. 2009. PMID: 19556508 Free PMC article.
-
STAT3 revs up the powerhouse.Sci Signal. 2009 Sep 29;2(90):pe61. doi: 10.1126/scisignal.290pe61. Sci Signal. 2009. PMID: 19797267 Review.
-
STAT3 as a mediator of oncogenic cellular metabolism: Pathogenic and therapeutic implications.Neoplasia. 2021 Dec;23(12):1167-1178. doi: 10.1016/j.neo.2021.10.003. Epub 2021 Oct 29. Neoplasia. 2021. PMID: 34731785 Free PMC article. Review.
Cited by
-
STAT3 signaling in immunity.Cytokine Growth Factor Rev. 2016 Oct;31:1-15. doi: 10.1016/j.cytogfr.2016.05.001. Epub 2016 May 9. Cytokine Growth Factor Rev. 2016. PMID: 27185365 Free PMC article. Review.
-
A Synthetic Lethal Interaction between Glutathione Synthesis and Mitochondrial Reactive Oxygen Species Provides a Tumor-Specific Vulnerability Dependent on STAT3.Mol Cell Biol. 2015 Nov;35(21):3646-56. doi: 10.1128/MCB.00541-15. Epub 2015 Aug 17. Mol Cell Biol. 2015. PMID: 26283727 Free PMC article.
-
Toll-like receptor 2 regulates metabolic reprogramming in gastric cancer via superoxide dismutase 2.Int J Cancer. 2019 Jun 15;144(12):3056-3069. doi: 10.1002/ijc.32060. Epub 2019 Jan 7. Int J Cancer. 2019. PMID: 30536754 Free PMC article.
-
Perspectives Regarding the Intersections between STAT3 and Oxidative Metabolism in Cancer.Cells. 2020 Sep 29;9(10):2202. doi: 10.3390/cells9102202. Cells. 2020. PMID: 33003453 Free PMC article. Review.
-
Stress-induced dynamic regulation of mitochondrial STAT3 and its association with cyclophilin D reduce mitochondrial ROS production.Sci Signal. 2017 Mar 28;10(472):eaag2588. doi: 10.1126/scisignal.aag2588. Sci Signal. 2017. PMID: 28351946 Free PMC article.
References
-
- Beaupre DM, Kurzrock R. RAS and leukemia: from basic mechanisms to gene-directed therapy. J Clin Oncol. 1999;17(3):1071–1079. - PubMed
-
- Beghini A, Ripamonti CB, Cairoli R, et al. KIT activating mutations: incidence in adult and pediatric acute myeloid leukemia, and identification of an internal tandem duplication. Haematologica. 2004;89(8):920–925. - PubMed
-
- Care RS, Valk PJ, Goodeve AC, et al. Incidence and prognosis of c-KIT and FLT3 mutations in core binding factor (CBF) acute myeloid leukaemias. Br J Haematol. 2003;121(5):775–777. - PubMed
-
- Kalra R, Paderanga DC, Olson K, Shannon KM. Genetic analysis is consistent with the hypothesis that NF1 limits myeloid cell growth through p21ras. Blood. 1994;84(10):3435–3439. - PubMed
Publication types
MeSH terms
Substances
Grants and funding
- R01 CA173636/CA/NCI NIH HHS/United States
- R01 CA133379/CA/NCI NIH HHS/United States
- R01AI28900/AI/NIAID NIH HHS/United States
- R01CA133379/CA/NCI NIH HHS/United States
- U54AI057158/AI/NIAID NIH HHS/United States
- R01 CA149655/CA/NCI NIH HHS/United States
- R01 CA105129/CA/NCI NIH HHS/United States
- U54 AI057158/AI/NIAID NIH HHS/United States
- R01 AI028900/AI/NIAID NIH HHS/United States
- R01CA149655/CA/NCI NIH HHS/United States
- R01CA105129/CA/NCI NIH HHS/United States
- HHMI_/Howard Hughes Medical Institute/United States
- R01 GM088847/GM/NIGMS NIH HHS/United States
- P30 CA016087/CA/NCI NIH HHS/United States
- 5P30CA016087-32/CA/NCI NIH HHS/United States
- R01GM088847/GM/NIGMS NIH HHS/United States
- R01 CA169784/CA/NCI NIH HHS/United States
LinkOut - more resources
Full Text Sources
Other Literature Sources
Molecular Biology Databases
Miscellaneous

