. 2014 Aug 21;10(8):e1004282.
doi: 10.1371/journal.ppat.1004282. eCollection 2014 Aug.

Ly6Chi monocyte recruitment is responsible for Th2 associated host-protective macrophage accumulation in liver inflammation due to schistosomiasis

Affiliations

Ly6Chi monocyte recruitment is responsible for Th2 associated host-protective macrophage accumulation in liver inflammation due to schistosomiasis

Marcia Nascimento et al. PLoS Pathog. .

Abstract

Accumulation of M2 macrophages in the liver, within the context of a strong Th2 response, is a hallmark of infection with the parasitic helminth, Schistosoma mansoni, but the origin of these cells is unclear. To explore this, we examined the relatedness of macrophages to monocytes in this setting. Our data show that both monocyte-derived and resident macrophages are engaged in the response to infection. Infection caused CCR2-dependent increases in numbers of Ly6Chi monocytes in blood and liver and of CX3CR1+ macrophages in diseased liver. Ly6Chi monocytes recovered from liver had the potential to differentiate into macrophages when cultured with M-CSF. Using pulse chase BrdU labeling, we found that most hepatic macrophages in infected mice arose from monocytes. Consistent with this, deletion of monocytes led to the loss of a subpopulation of hepatic CD11chi macrophages that was present in infected but not naïve mice. This was accompanied by a reduction in the size of egg-associated granulomas and significantly exacerbated disease. In addition to the involvement of monocytes and monocyte-derived macrophages in hepatic inflammation due to infection, we observed increased incorporation of BrdU and expression of Ki67 and MHC II in resident macrophages, indicating that these cells are participating in the response. Expression of both M2 and M1 marker genes was increased in liver from infected vs. naive mice. The M2 fingerprint in the liver was not accounted for by a single cell type, but rather reflected expression of M2 genes by various cells including macrophages, neutrophils, eosinophils and monocytes. Our data point to monocyte recruitment as the dominant process for increasing macrophage cell numbers in the liver during schistosomiasis.


Conflict of interest statement

The authors have declared that no competing interests exist.

Figures

Figure 1
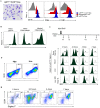
Figure 1. Schistosomiasis induces monocytosis.
Ly6Chi and Ly6Clo monocytes were identified in the blood and bone marrow by flow cytometry, and enumerated by back-calculation from nucleated cell counts. A. The Ly6Chi CD115+ CD11b+ population of monocytes expands in the peripheral blood of 7 week infected mice. Numbers outside boxed areas indicate percentages of total indicated populations. B. The number of Ly6Chi monocytes circulating in infected mice (I) is significantly greater than in naïve mice (N). C. Plasma concentrations of CCL2 and CCL7. D. Kinetics of increase in Ly6Chi monocyte numbers in the blood during infection. E. Increased contribution of Ly6Chi monocytes to the CD11b+ compartment within the bone marrow as a result of infection. F. Numbers of Ly6Chi monocytes in the bone marrow of naïve (N) and infected (I) mice. Data in A and E are concatenated from samples from 3 to 5 mice per group. Graphs B, D and F present mean ± SEM of three to five mice/group. P values of 0.05 or less are marked by an asterisk. Data are representative of findings from at least 3 experiments, except for C, where pooled samples from 5 mice per group were measured once.
Figure 2
Figure 2. Hepatic inflammation during infection is associated with increased numbers of monocytes, neutrophils, eosinophils and macrophages.
A. The gating strategy for identifying and sorting monocytes, neutrophils, eosinophils and macrophages from leukocyte populations isolated from the livers of 7 week infected mice; data from naïve mice are shown for comparison. Numbers inside or outside boxed areas indicate percent cells. #1: monocytes. #2: neutrophils. #3 eosinophils. #4: macrophages. B. Images of cytospins of cells from gates 1–4. C. Numbers of indicated cells in the livers of naïve (N) and infected (I) mice, as enumerated by flow cytometry and back-calculation from counts of nucleated cells. Data are representative of five independent experiments. Graphs present the mean ± SEM of five mice/group. **P<0.01 and *** P<0.001, as determined by two-tailed t test.
Figure 3
Figure 3. Monocytes give rise to macrophages within the liver during infection.
A. Ly6Chi monocytes sorted from liver of infected mice differentiate into macrophages following culture with M-CSF: a cytospin of macrophages grown in this way is shown (left panel) along with flow cytometric analysis of the same cells vs. macrophages or Ly6Chi monocytes sorted from infected liver (ex vivo) for expression of MertK and CD64 (right panel). This experiment was repeated three times with similar results. B. The expression of GFP in blood monocytes (Ly6Chi CD11b+) from naïve mice, and on CD64+MertK+ macrophages from naïve or infected Cx3cr1gfp/+ mice. Data are from cells pooled from 3 individual mice, and are representative of two independent experiments. C. BrdU is rapidly incorporated into monocytes and appears in macrophages only later following initiation of labeling. Infected mice were injected with BrdU and bone marrow, blood, and hepatic leukocytes collected at the times shown were pooled and monocytes and macrophages (Mphi) were stained for incorporated BrdU. Results are data from one independent experiment with three to five mice per group, and are representative of 3 independent experiments. D. BrdU incorporation into peritoneal macrophages in mice injected i.p. with IL-4/anti-IL-4 complexes. Data are concatenated from 3 mice per group and are representative of 2 independent experiments. E. Within the entire BrdU labeled hepatic leukocyte population, CD64+ Siglec-Fhi macrophages initially represent only a small percentage of all cells, but over time post-labeling come to represent 75% of the labeled population (by day 7). In these plots, monocytes fall within the indicated CD64int Siglec-FNeg gate; these data are from the experiments described in C.
Figure 4
Figure 4. Infection induced monocytosis and increases in macrophage numbers within the liver are CCR2-dependent.
The frequency (A) and overall number (B) of Ly6Chi monocytes in the blood of infected Ccr2−/− mice is significantly lower than in infected WT mice. Numbers beside boxed areas indicate percent of total. C. The frequency of Ly6Chi monocytes in the hepatic infiltrate is reduced in the absence of CCR2, while the frequency of Ly6Ghi cells increases. Numbers outside boxed areas indicate percent of total. D. Overall increases in hepatic leukocyte numbers due to infection in WT and Ccr2−/− mice are similar (N: naïve, I: infected); each point represents data from an individual mouse. Total numbers of Ly6Chi monocytes (E), macrophages (F) and neutrophils (G) in the hepatic infiltrate of infected (I) vs. naïve (N) WT and Ccr2−/− mice. Cells gated as in Fig. 2 2. The data in A and C are concatenated from 3 mice per group. Data in B, D, E, F and G present the mean ± SEM of three or more mice/group. Data in all panels are representative of four independent experiments. *P<0.05 and *** P<0.001.
Figure 5
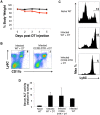
Figure 5. Depletion of monocytes in infected mice leads to severe acute weight loss.
Infected wild type (WT) and CCR2-DTR mice were treated with DT beginning at week 6 of infection, weighed intermittently thereafter, and bled on the 5th day following initiation of the treatment. A. Weight loss, shown as a percentage of the starting weight. Data from 3 individual mice per group are shown. B. Expression of Ly6c and CD11b on mononuclear blood cells, as measured by flow cytometry. Numbers represent percentages of total cells that fall within the indicated gates. Data are from pooled bleeds from 3 mice. Data in both panels are from one experiment, and representative of 2 independent experiments. C. The frequency of Ly6Chi monocytes within the liver is increased as a result of infection, and reduced in CCR2-DTR mice following treatment with DT. Monocytes were identified by flow cytometry by sequential gating of live cells that were Siglec-FNEG, MerTKNEG, CD64LO/INT, CD11b+, F4/80+ and (as shown) Ly6cHI. Monocytes in livers of naïve WT mice, infected WT mice treated with DT, and infected CCR2-DTR mice treated with DT, as indicated. The monocyte gate is indicated and numbers refer to percentages of F4/80+ cells that fall within that gate. Data are from one experiment, representative of 2 independent experiments. D. Serum ALT levels. ALT activity in serum naïve mice was set to one, and fold increases in activity in serum from infected mice, as indicated, are shown. For the experimental groups, data are mean ± SD of values from 3 individual mice.
Figure 6
Figure 6. Monocyte depletion leads to the loss of a population of CD11chiMHCIIhi macrophages from the livers of infected mice.
A. Live cells isolated from the livers of naïve WT mice, or infected WT mice or infected CCR2-DTR mice treated with DT, were stained with antibodies against MerTK, CD64, F4/80 and CD11c and flow cytometry was used to measure expression of F4/80 and CD11c on MerTK+CD64+ cells. Numbers outside gated areas indicate percent of total. B. MHC II expression and Ki67 expression in CD11clo and CD11chi macrophages (defined as in A) were measured by flow cytometry.
Figure 7
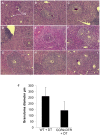
Figure 7. Depletion of monocytes results in reduced granuloma formation.
Representative granulomas from acutely infected, DT treated CCR2-DTR (AF) and WT mice (GI). All images were photographed at 40×. In D – I, granulomas are delimited with a white line. Parasite eggs are clearly visible within each image (identified in panel A for orientation). J. Granuloma diameter. Bars are mean values ± SD of the diameters of 15 granulomas measured in liver sections from 3 infected mice (5 granulomas per mouse). The difference in size between the two groups is statistically significant at p<0.002 (Student's t test).
Figure 8
Figure 8. The M2 activation profile in the liver during infection results from differential expression of various M2 genes by distinct subpopulations of infiltrating leukocytes.
Quantitative real-time PCR analysis of: A. Arg1, Rtlna, Chi3l3, Tnf, and Nos2 mRNA in whole liver, comparing naïve (N) to infected (I) mice. B. Arg1, Rtlna, Chi3l3 mRNA in the indicated cell populations, FACS-purified from livers of infected mice, presented as fold increase relative to expression in blood Ly6Chi cells from naive mice. C. Tnf, and Nos2 mRNA in cell populations as described in B. The data represent mean values ± SEM of data from 2 experiments, in each of which tissue or cells were pooled from 2 or more animals.

Similar articles

Cited by

References

    1. Fairfax K, Nascimento M, Huang SC, Everts B, Pearce EJ (2012) Th2 responses in schistosomiasis. Semin Immunopathol 34: 863–871. - PubMed
    1. Auffray C, Sieweke MH, Geissmann F (2009) Blood monocytes: development, heterogeneity, and relationship with dendritic cells. Annu Rev Immunol 27: 669–692. - PubMed
    1. Serbina NV, Jia T, Hohl TM, Pamer EG (2008) Monocyte-mediated defense against microbial pathogens. Annu Rev Immunol 26: 421–452. - PMC - PubMed
    1. Serbina NV, Shi C, Pamer EG (2012) Monocyte-mediated immune defense against murine Listeria monocytogenes infection. Adv Immunol 113: 119–134. - PMC - PubMed
    1. Jenkins SJ, Ruckerl D, Cook PC, Jones LH, Finkelman FD, et al. (2011) Local macrophage proliferation, rather than recruitment from the blood, is a signature of TH2 inflammation. Science 332: 1284–1288. - PMC - PubMed

Publication types