. 2014 Oct 15;25(20):3195-209.
doi: 10.1091/mbc.E14-07-1229. Epub 2014 Aug 20.

Cdc42 controls the dilation of the exocytotic fusion pore by regulating membrane tension

Affiliations

Cdc42 controls the dilation of the exocytotic fusion pore by regulating membrane tension

Marine Bretou et al. Mol Biol Cell. .

Abstract

Membrane fusion underlies multiple processes, including exocytosis of hormones and neurotransmitters. Membrane fusion starts with the formation of a narrow fusion pore. Radial expansion of this pore completes the process and allows fast release of secretory compounds, but this step remains poorly understood. Here we show that inhibiting the expression of the small GTPase Cdc42 or preventing its activation with a dominant negative Cdc42 construct in human neuroendocrine cells impaired the release process by compromising fusion pore enlargement. Consequently the mode of vesicle exocytosis was shifted from full-collapse fusion to kiss-and-run. Remarkably, Cdc42-knockdown cells showed reduced membrane tension, and the artificial increase of membrane tension restored fusion pore enlargement. Moreover, inhibiting the motor protein myosin II by blebbistatin decreased membrane tension, as well as fusion pore dilation. We conclude that membrane tension is the driving force for fusion pore dilation and that Cdc42 is a key regulator of this force.


Figures

FIGURE 1:
FIGURE 1:
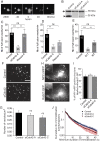
Cdc42 knockdown impairs full fusion but has little effect on SG recruitment at the plasma membrane. BON cells were transfected with a vector encoding NPY tagged with a fluorescent protein (mRFP, GFP, or pHluorin, a pH-sensitive GFP variant) and with control or siCdc42 siRNA duplexes. (A) A typical full-collapse exocytotic event captured by TIRFM. The fluorescence of the vesicular content marker NPY-GFP briefly increases upon exocytosis (arrow) and then decays to background levels as NPY-GFP diffuses. Bar, 1 μm. Time is indicated in milliseconds. In this example, the acquisition rate was >10 Hz, as used elsewhere in this study. (B) A representative Western blot showing reduced Cdc42 levels (arrowhead) in siCdc42-A– and siCdc42-C–treated BON cells. The observed reduction was 90.1 ± 2.7% (p < 0.001) with siCdc42-A (n = 8 independent experiments) and 68.9 ± 12.7% (p < 0.001) with siCdc42-C (n = 10 independent experiments). Tubulin staining (arrow) was used to normalize the Cdc42 signal. (C, D) Cdc42 knockdown decreases the number of full-fusion events. The mean (±SEM) number of events observed per cell in the different conditions: cells treated with control (luciferase-targeting siRNAs), siCdc42-A (C), or siCdc42-C (D) siRNAs. Coexpressing HA-tagged Cdc42 constructs insensitive to siCdc42-A (rescue-A) or to siCdc42-C (rescue-C) restored at least partially the secretory responses. For imaging, cells were selected on the basis of their NPY-mRFP fluorescence. Rescue-A and rescue-C were not visible in live cells, but control experiments revealed that they were consistently expressed in cells cotransfected with NPY-mRFP. The number of analyzed cells is indicated in the bars. **p < 0.01; ***p < 0.001 (Kruskal–Wallis followed by Dunn's test); ns, non significant. (E) Overexpression of mCherry-tagged Cdc42-N17, but not mCherry-Cdc42 WT, decreases the occurrence of full-fusion events compared with control cells expressing only mCherry. (F, G) The spatial distribution of SGs was analyzed by TIRFM under resting conditions in control or siCdc42-treated cells. (F) Representative images. (G) The juxtamembrane SG density was not significantly affected by Cdc42 knockdown (n = 18 cells from three independent experiments in each group). The size of cell footprints was not modified by Cdc42 silencing. (H, I) Confocal imaging of BON cells revealed that the majority of NPY-mRFP–positive structures are also labeled by GFP-Rab27a, which is associated with the cytoplasmic side of the SG membrane. This proportion was not affected by Cdc42 knockdown, as indicated by the quantification shown in I (mean ± SEM; n = 12 cells in each condition), suggesting unimpaired SG biogenesis. Representative images of SiCdc42-C-treated cells. Insets are zoomed-in views of the boxed areas. Bar, 5 μm. (J) Single SGs imaged by TIRFM were tracked, and the Dxy values were computed along trajectories using a rolling analysis window. Subtrajectories characterized by a Dxy lower than the threshold value of 5 × 10⁻⁴ μm2/s were defined as an immobilization period. A survival plot of immobilization events is shown. Control, 19 cells, 2978 trajectories; siCdc42-A, 18 cells, 2283 trajectories; siCdc42-C, 17 cells, 2917 trajectories; from three independent experiments. Data were fitted with the sum of two exponentials. Cdc42 silencing did not significantly alter SG immobilization, suggesting unimpaired SG attachment at the plasma membrane.
FIGURE 2:
FIGURE 2:
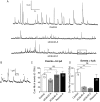
Cdc42 knockdown reduces the occurrence of large spikes but not the overall probability of exocytosis. (A) Representative amperometric recordings of ionomycin-stimulated BON cells. Each spike reports an exocytotic event. (B) Enlarged view of a part (boxed area) of the bottom trace shown in A. Stars highlight events characterized by an irregular shape suggestive of fast fluctuations of the pore size. (C, D) Cumulative number of exocytotic events observed in stimulated BON cells treated with control siRNAs, siCdc42-A, or siCdc42-C, as indicated. Spikes were counted as an event when their height was >0.4 pA (C) or >4 pA (D). The significance of the differences was computed using a Kruskal–Wallis test followed by a Dunn's test for multiple comparisons. *p < 0.05; ***p < 0.001. Expressing a Cdc42 construct insensitive to siCdc42-A (rescue-A) reduced the effect of Cdc42 knockdown. Comparing siCdc42-A and rescue-A with a Mann–Whitney test yielded p = 0.0056 and 0.0207 in C and D, respectively. The number of cells is indicated in the bars.
FIGURE 3:
FIGURE 3:
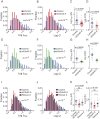
Cdc42 knockdown reduces the efflux of serotonin upon exocytosis. BON cells were treated with control siRNAs (blue), siCdc42-A (red), siCdc42-C (green), or siCdc42-A and the rescue-A construct (black) and stimulated with ionomycin. Log-transformed values of the maximal spike height Imax and quantal size Q of amperometric spikes are reduced upon Cdc42 silencing, as indicated by the distribution of pooled spike values (A, B, E, F, I, J) and the mean values of these parameters measured in each cell (C, D, G, H, K, L). The significance of the differences in distributions was computed using an ANOVA test (see Materials and Methods) followed by a Tukey posttest; N = 3610 (control in A and B), 2954 (siCdc42-A in A and B), 1988 (control in E and F), 1586 (siCdc42-C), 2126 (control in I and J), 1334 (siCdc42-A in I and J), and 1642 (rescue-A) spikes. Significance of differences of mean values was computed by Mann–Whitney test (C, D, G, H) or Kruskal–Wallis test followed by Dunn's posttest (K, L).
FIGURE 4:
FIGURE 4:
Cdc42 knockdown does not modify SG size and SG serotonin uptake. (A) STED images of SGs. BON cells were transfected with pNPY-mRFP, pNPY-pHluorin, and control, siCdc42-A, or siCdc42-C siRNA duplexes, as indicated. Three days later, the cells were fixed, and SGs were labeled with anti-GFP antibodies and atto532-coupled secondary antibodies. The cells were imaged using STED microscopy, and the images were segmented using MIA (bottom). We analyzed 1856 SGs from nine control cells, 2194 SGs from 11 siCdc42-A cells, and 2268 SGs from 12 siCdc42-C cells. The mask is shown to illustrate the identification of structures by MIA. Each object is given a particular color. Scale bar, 1 μm. (B) The resolution of the STED microscope was estimated by measuring the half-width (here 38 nm) of the Gaussian profile fitted to the fluorescence intensity along the cross section of a small SG. Bar, 500 nm. (C) Dot plots of SG diameter. Diameters were computed from the area of the segmented SGs, assuming a circular shape. Each dot represents the mean value of SG diameter in a given cell. The data indicate that Cdc42 knockdown did not change SG size (p = 0.67, one-way ANOVA). (D) BON cells were transfected with bVMAT1 and control, siCdc42-A, or siCdc42-C siRNA duplexes, as indicated. Three days later, the cells were incubated for 2 h at 37°C with [3H]serotonin in the presence or the absence of 1 μM reserpine, an inhibitor of the vesicular monoamine transporter. The mean (N = 3 wells/condition) amount of [3H]serotonin taken up by the cells after subtraction of the signal measured in the presence of reserpine were expressed as percentage of the value measured in cells transfected with control siRNAs and averaged (±SEM) over three independent experiments.
FIGURE 5:
FIGURE 5:
Cdc42 knockdown impairs the enlargement of nascent fusion pores. (A) Characteristic view of an amperometric spike preceded by a PSF. Cdc42 knockdown did not change the PSF duration (B) but reduced the flux of serotonin through the nascent pore, as indicated by the decreased PSF maximal amplitude (C). ***p < 0.0001; Kruskal–Wallis test followed by Dunn's test; n = 166 (control), 72 (siCdc42-A), and 45 PSFs (siCdc42-C).
FIGURE 6:
FIGURE 6:
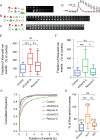
A dual-color TIRFM assay to measure the dynamics of the fusion pore. BON cells expressing both NPY-mRFP and NPY-pHluorin were stimulated with ionomycin and imaged by dual-color TIRFM. (A) Cartoons and time-series images (10 Hz) showing the behavior of pH-insensitive (mRFP, red, top) and pH-sensitive (pHluorin, green, bottom) vesicular content markers upon full-collapse fusion. Fast diffusion of fluorescent markers in the external medium is captured as a fluorescent halo surrounding the SG and leads to complete disappearance of SG fluorescence. In kiss-and-run events (B, C), the pore does not fully enlarge, and NPY-mRFP is slowly (B) or not (C) released; in some cases, the pore reseals (C), leading to reacidification of the SG, as indicated by a decay of the green signal. (D) Mean (±SEM) time course of the fluorescence (arbitrary units) of events associated with (red) or without (blue) a fluorescent halo. (E–G) Cdc42 knockdown increases the fraction of kiss-and-run events (p < 0.0001, Kruskal–Wallis followed by Dunn's test; **p < 0.01; ***p < 0.001). These values were measured in each cell, normalized to the mean value found in control cells, and averaged over the different cells from the same group. The number of analyzed cells is indicated in the bars or above the boxes. NS, nonsignificant. Both effects are rescued by expressing a Cdc42 construct insensitive to siCdc42-A (E, rescue-A) or to siCdc42-C (F, rescue-C). In these experiments, the mean (±SEM) percentage of kiss-and-run events in control cells was 26.6 ± 2.3%. (G) Cdc42 knockdown increased the duration of the pHluorin signal. Cumulative distribution of the pHluorin signal duration measured using an automatic routine. A total of 2746 (control), 1595 (siCdc42-A), 1193 (rescue-A), 727 (siCdc42-C), and 394 (rescue-C) events were automatically analyzed. (H) Expressing a dominant negative Cdc42 construct (mCherry-Cdc42-N17) decreased the fraction of kiss-and-run events, whereas expressing WT Cdc42 had no significant effect. Whiskers in box plots indicate 10th–90th percentiles. Scale bars, 1 μm.
FIGURE 7:
FIGURE 7:
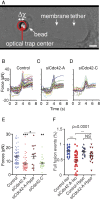
Cdc42 knockdown decreases membrane tension. (A) An optically trapped concanavalin A–coated latex bead is placed in contact with the cell until it is bound to the membrane and then pulled away to extract a membrane tether. The force exerted by the membrane tether is proportional to the square root of the effective membrane tension and displaces the bead from the center of the optical trap. Scale bar, 2 μm. Measurements were performed in the presence of ionomycin. (B–D) Plots of the force vs. time recorded in single cells transfected with control siRNAs (39 cells, B), siCdc42-A (29 cells, C), and siCdc42-C (13 cells, D). Traces comprise an initial peak in the force plot likely to reflect tether extraction, followed by a relatively stable plateau region (5–7 s). (E) Dot plot of the mean force measured during the plateau (i.e., 1–3 s after the spike). Cdc42 knockdown shifted the force to lower values, but bathing siCdc42-A–treated cells in a hypo-osmotic medium (250 mosm; siCdc42-A-Hypo) restored a force similar to that measured under iso-osmotic conditions. Values were obtained from 68 (control), 52 (siCdc42-A), 16 (siCdc42-A Hypo), and 28 (siCdc42-C) cells. (F) BON cells stimulated by ionomycin under iso- or hypo-osmotic conditions were analyzed as in Figure 6. Cdc42 knockdown reduced the fraction of full-fusion events under iso- but not hypo-osmotic conditions. The significance of differences was analyzed with a Kruskal–Wallis test followed by Dunn's posttest (E) or with ANOVA and Bonferroni's multiple comparison test (F); *p < 0.05, **p < 0.01, ***p < 0.001.
FIGURE 8:
FIGURE 8:
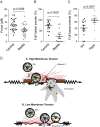
Effect of membrane tension on the final step of exocytosis. (A, B) Myosin II controls membrane tension and fusion pore dilation. (A) BON cells were treated with 50 μM blebbistatin (Blebbi) or the same amount of dimethyl sulfoxide (Control) for 10–30 min. Blebbistatin induced a significant reduction in tether force, measured as described in Figure 7 in the presence of ionomycin. (B) BON cells expressing NPY-pHluorin and NPY-mRFP were stimulated by ionomycin after a 10- to 30-min treatment with or without 50 μM blebbistatin, as indicated (Blebbi). Blebbistatin induced a reduction in the percentage of full-fusion events. (C) BON cells transiently expressing NPY fused in tandem with mRFP and pHluorin were imaged by TIRFM and stimulated by ionomycin under iso- or hypo-osmotic conditions. The graph shows that elevating membrane tension by inflating cells increases the percentage of full-fusion events. The significance of differences was analyzed with a Mann–Whitney test. (D) Schematic model depicting the effect of membrane tension on the final step of exocytosis. Fusion of the SG membrane with the plasma membrane (PM) mediates the release of different-sized molecules such as hormones or neurotransmitters, depending on the size of the fusion pore. A, the nascent, narrow fusion pore may eventually dilate to allow complete release of the SG content. Pore dilation relies on the GTPase Cdc42 and the motor protein myosin II, which are major regulators of the actomyosin cytoskeleton and set the PM lateral tension, the force acting on the spring. B, inhibiting Cdc42 or myosin II reduces membrane tension and impairs fusion pore dilation, shifting the fusion process from full-collapse fusion to kiss-and-run.

Similar articles

Cited by

References

    1. Amatore C, Arbault S, Bonifas I, Bouret Y, Erard M, Guille M. Dynamics of full fusion during vesicular exocytotic events: release of adrenaline by chromaffin cells. Chemphyschem. 2003;4:147–154. - PubMed
    1. Amatore C, Arbault S, Bouret Y, Guille M, Lemaitre F, Verchier Y. Regulation of exocytosis in chromaffin cells by trans-insertion of lysophosphatidylcholine and arachidonic acid into the outer leaflet of the cell membrane. Chembiochem. 2006;7:1998–2003. - PubMed
    1. Amatore C, Bouret Y, Travis ER, Wightman RM. Adrenaline release by chromaffin cells: constrained swelling of the vesicle matrix leads to full fusion. Angew Chem Int Ed Engl. 2000;39:1952–1955. - PubMed
    1. Anantharam A, Bittner MA, Aikman RL, Stuenkel EL, Schmid SL, Axelrod D, Holz RW. A new role for the dynamin GTPase in the regulation of fusion pore expansion. Mol Biol Cell. 2011;22:1907–1918. - PMC - PubMed
    1. Balaji J, Ryan TA. Single-vesicle imaging reveals that synaptic vesicle exocytosis and endocytosis are coupled by a single stochastic mode. Proc Natl Acad Sci USA. 2007;104:20576–20581. - PMC - PubMed

Publication types

MeSH terms

LinkOut - more resources