. 2014 Sep 26;289(39):27246-27263.
doi: 10.1074/jbc.M114.590240. Epub 2014 Aug 11.

Chemotherapeutic drugs induce ATP release via caspase-gated pannexin-1 channels and a caspase/pannexin-1-independent mechanism

Affiliations

Chemotherapeutic drugs induce ATP release via caspase-gated pannexin-1 channels and a caspase/pannexin-1-independent mechanism

Andrea Boyd-Tressler et al. J Biol Chem. .

Abstract

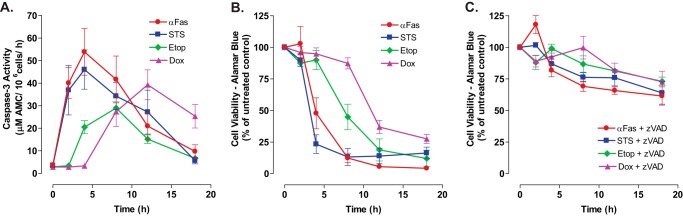
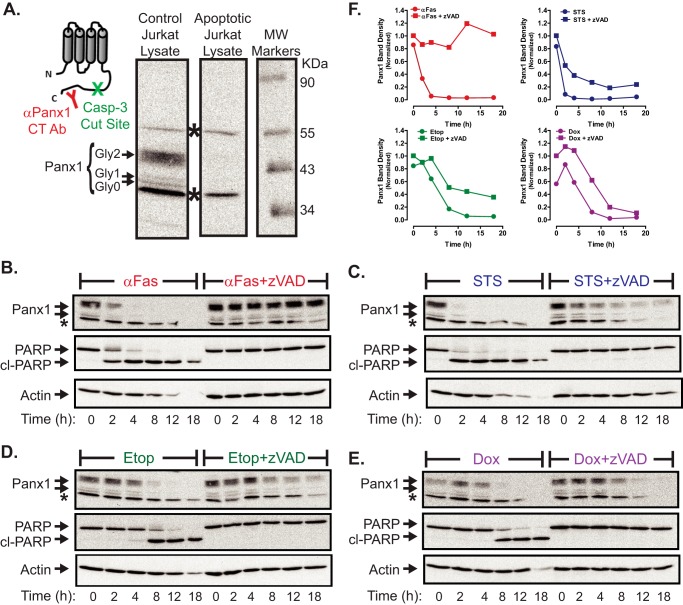
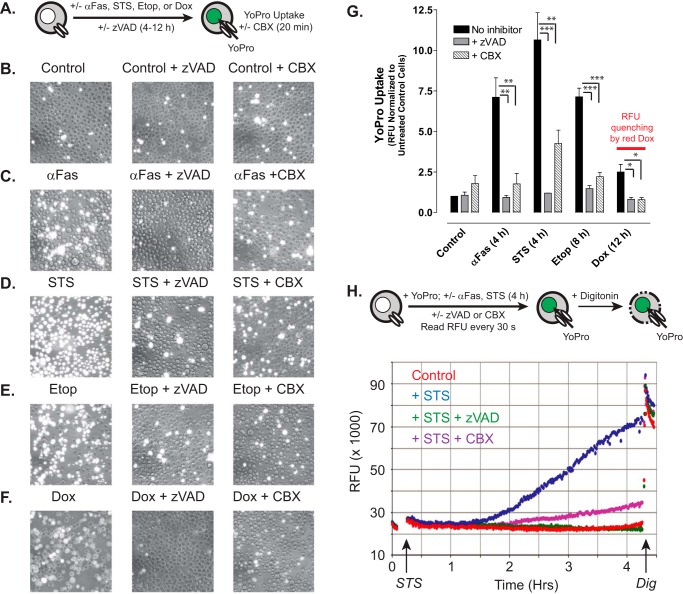
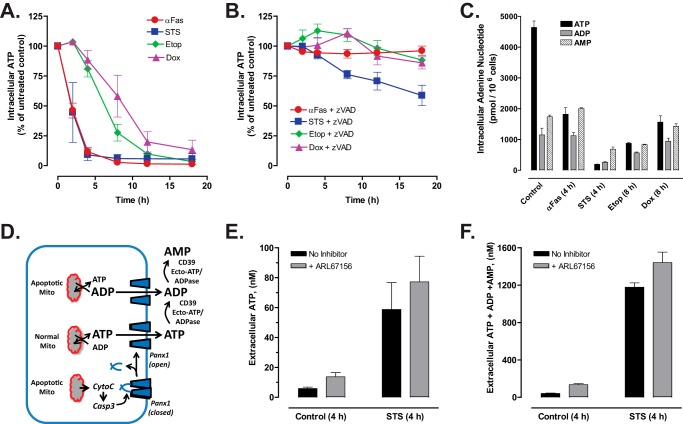
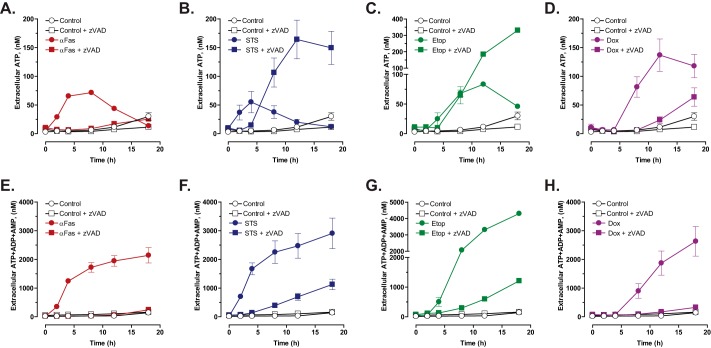
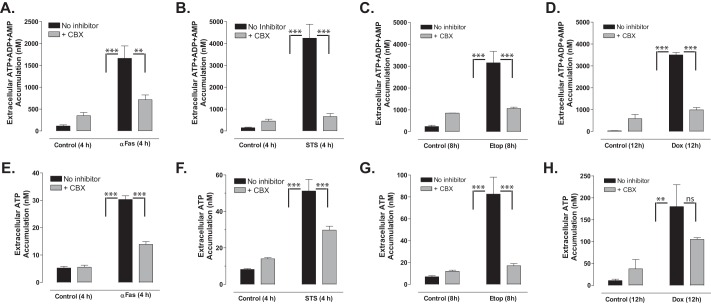
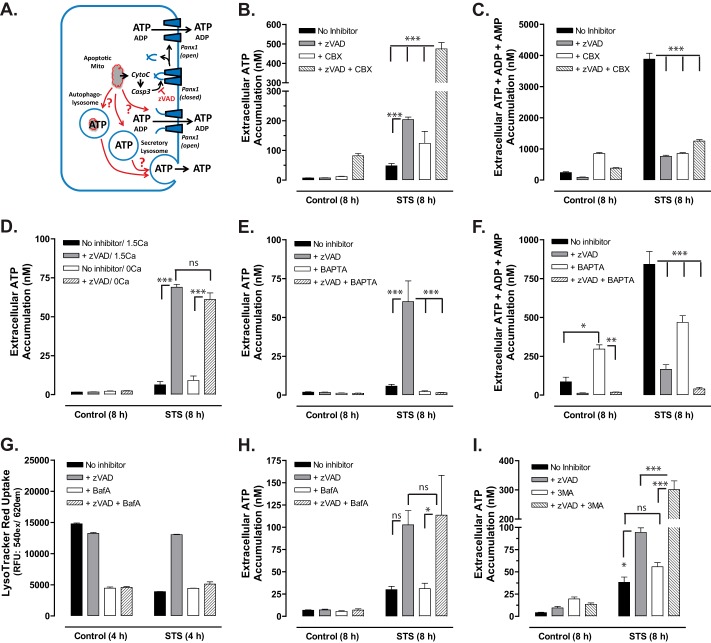
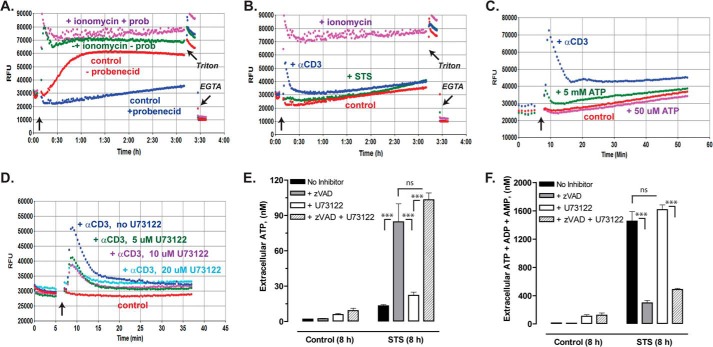
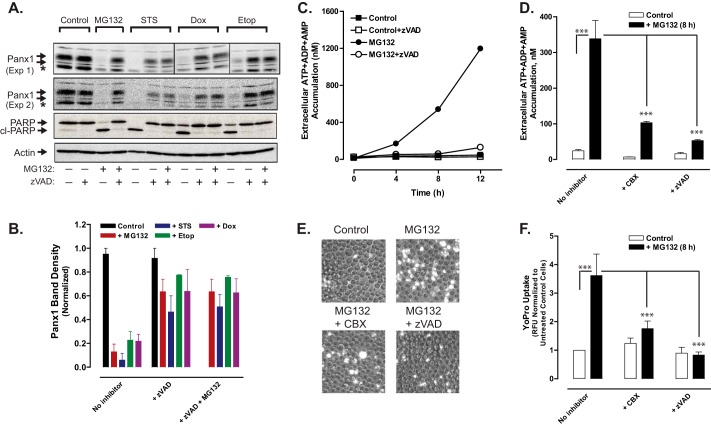
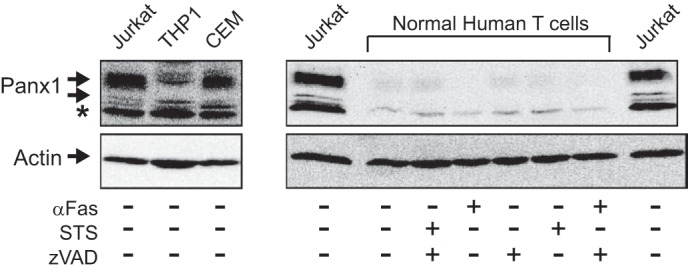
Anti-tumor immune responses have been linked to the regulated release of ATP from apoptotic cancer cells to engage P2 purinergic receptor signaling cascades in nearby leukocytes. We used the Jurkat T cell acute lymphocytic leukemia model to characterize the role of pannexin-1 (Panx1) channels in the release of nucleotides during chemotherapeutic drug-induced apoptosis. Diverse pro-apoptotic drugs, including topoisomerase II inhibitors, kinase inhibitors, and proteosome inhibitors, induced functional activation of Panx1 channels via caspase-3-mediated cleavage of the Panx1 autoinhibitory C-terminal domain. The caspase-activated Panx1 channels mediated efflux of ATP, but also ADP and AMP, with the latter two comprising >90% of the released adenine nucleotide pool as cells transitioned from the early to late stages of apoptosis. Chemotherapeutic drugs also activated an alternative caspase- and Panx1-independent pathway for ATP release from Jurkat cells in the presence of benzyloxycarbonyl-VAD, a pan-caspase inhibitor. Comparison of Panx1 levels indicated much higher expression in leukemic T lymphocytes than in normal, untransformed T lymphoblasts. This suggests that signaling roles for Panx1 may be amplified in leukemic leukocytes. Together, these results identify chemotherapy-activated pannexin-1 channels and ATP release as possible mediators of paracrine interaction between dying tumor cells and the effector leukocytes that mediate immunogenic anti-tumor responses.

Keywords: ATP; Apoptosis; Caspase; Pannexin; Purinergic Agonist.


Figures

FIGURE 1.
FIGURE 1.
Comparative time courses for accumulation of active caspase-3 and loss of viability in Jurkat leukemic T cells treated with different chemotherapeutic agents. A, Jurkat T cells were treated with anti-Fas (250 ng/ml), STS (3 μm), Etop (20 μm), or Dox (25 μm). Cell lysates were prepared at the indicated times and then assayed for caspase 3 activity. Experiments with each agent were repeated 2–5 times with data indicating mean ± S.E. for n = 4 (anti-Fas), n = 5 (STS and Dox); n = 2 (Etop). B and C, Jurkat T cells were treated with anti-Fas (250 ng/ml), STS (3 μm), Etop (20 μm), or Dox (25 μm) in the absence or presence of Z-VAD (50 μm for anti-Fas-stimulated cells or 100 μm for cells stimulated with STS, Etop, or Dox). At the indicated times, aliquots were taken and immediately assayed for cell viability by measuring metabolism of AlamarBlue® dye to its fluorescent resorufin product. Data indicate mean ± S.E. for n = 3 experiments.
FIGURE 2.
FIGURE 2.
Chemotherapeutic drugs induce caspase-3-mediated cleavage of the pannexin-1 C-terminal autoinhibitory domain. A, membrane topography of Panx1 protein subunit indicating the relative positions of the caspase-3 cleavage site and epitope recognized by the anti-Panx1 antibody used in the Western blot of cell lysates from control Jurkat cells or apoptotic Jurkat cells (20 μm Etop, 12 h). The indicated bands show the three different glycosylation states of Panx1 (Gly-0, core, Gly-1, high mannose species, and Gly-2, complex glycoprotein); * indicates nonspecific immunoreactive bands. B–E, Jurkat T cells were treated with 250 ng/ml anti-Fas (B), 3 μm STS (C), 20 μm Etop (D), or 25 μm Dox (E) in the absence or presence of Z-VAD (50 μm for anti-Fas or 100 μm for drugs). At the indicated times, aliquots were taken for Western blot analysis of Panx1, PARP1, and actin. Data are representative of 2–3 experiments with each pro-apoptotic stimulus. F, densitometric quantification of Panx1 bands in Western blots from B to E; bands were normalized to the densities of the t = 0-h samples for each experiment.
FIGURE 3.
FIGURE 3.
Chemotherapeutic drugs induce accumulation of active pannexin-1 channels via a caspase-dependent activation mechanism. A, schematic of the YoPro dye uptake end point assay. Jurkat T cells were incubated as follows: with no stimulus for 4 h (B); with 250 ng/ml anti-Fas, 4 h (C); 3 μm STS, 4 h (D); 20 μm Etop, 8 h (E); or 25 μm Dox (F) in the absence or presence of 100 μm Z-VAD. The treated cells were then washed, resuspended in basal saline supplemented with 1 μm YoPro ± 100 μm CBX, and incubated for 20 min prior to plate reader quantification of accumulated YoPro fluorescence per well (G) or phase-contrast and epifluorescence imaging (B–F). G, data indicate mean ± S.E. for n = 3 experiments for STS, Etop, and Dox, and n = 2 experiments for anti-Fas. *, p < 0.05; **, p < 0.01; ***, p < 0.001. H, schematic of the YoPro dye uptake kinetic assay. Jurkat cells were suspended in basal saline supplemented 1 μm YoPro ± 100 μm CBX ± 100 μm Z-VAD transferred to the wells of a 24-well plate. Fluorescence (485/540 nm) was measured at 1-min intervals for 15 min prior to addition of 3 μm STS (or vehicle) and then at 1-min intervals for an additional 4 h prior to the addition of digitonin (Dig) to permeabilize the cells. Data are representative of three experiments.
FIGURE 4.
FIGURE 4.
Efflux of both ATP and ATP metabolites is triggered during chemotherapeutic drug-induced apoptosis of Jurkat cells. Jurkat T cells were treated with 250 ng/ml anti-Fas, 3 μm STS, 20 μm Etop, or 25 μm Dox in the absence or presence of Z-VAD (50 μm for anti-Fas or 100 μm for drugs) as indicated. A and B, cell lysates were prepared at the indicated times and processed for measurement of intracellular ATP content as described under “Experimental Procedures.” ATP content in cells treated with pro-apoptotic agents was normalized to the ATP content in control cells. Experiments with each agent were repeated 2–5 times with data indicating mean ± S.E. for n = 4 (anti-Fas), n = 5 (STS and Dox), n = 2 (Etop). C, Jurkat cells were treated with anti-Fas or STS for 4 h or with Etop or Dox for 8 h. Heat-denatured cell extracts were prepared and assayed for intracellular ATP, ADP, and AMP content as described under “Experimental Procedures.” Data (mean ± S.E.) are from one experiment performed in triplicate. D, schematic of Panx1 activation by caspase-3 cleavage secondary to chemotherapeutic drug induction of intrinsic apoptosis via release of mitochondrial cytochrome c. Caspase-gated Panx1 channels will mediate efflux of cytosolic ATP and ADP (and AMP, data not shown), the levels of which will vary with progressive mitochondrial dysfunction. Following release, extracellular ATP and ADP can also hydrolyzed by ectonucleotidases. E and F, Jurkat cells were suspended in serum-free RPMI 1640 medium and treated with 3 μm STS for 4 h in the absence or presence of 100 μm ARL67156 ecto-nucleotidase inhibitor. Samples of the extracellular medium were processed for analysis of ATP only (E) or summed ATP + ADP + AMP (F). Data indicate mean ± S.E. for n = 6 wells from two experiments.
FIGURE 5.
FIGURE 5.
Caspase-activated pannexin-1 channels mediate the efflux of ATP and ATP metabolites during chemotherapeutic drug-induced apoptosis but an alternative ATP release mechanism is engaged in the context of suppressed caspase activity. Jurkat T cells were treated with 250 ng/ml anti-Fas (A and E), 3 μm STS (B and F), 20 μm Etop (C and G), or 25 μm Dox (D and H) in the absence or presence of Z-VAD (50 μm for anti-Fas or 100 μm for drugs) as indicated. Samples of the extracellular medium were processed for analysis of ATP only (A–D) or summed ATP + ADP + AMP (E–H). Data indicate mean ± S.E. for n = 4–6 wells from two to three experiments (n = 4 for A, B, D, G, and H; n = 6 for E and F).
FIGURE 6.
FIGURE 6.
Carbenoxolone blocks the efflux of ATP and ATP metabolites during chemotherapeutic drug-induced apoptosis. Jurkat T cells were incubated with no stimulus, with 250 ng/ml anti-Fas, 4 h (A and E); 3 μm STS, 4 h (B and F); 20 μm Etop, 8 h (C and G); or 25 μm Dox, 12 h (D and H) in the absence or presence of 100 μm CBX (A–D) or 500 μm CBX (E–H). Samples of the extracellular medium were processed for analysis of summed ATP + ADP + AMP (A–D) or ATP only (E–H). Data indicate mean ± S.E. for n = 2–3 experiments each performed in triplicate. **, p < 0.01; ***, p < 0.001.
FIGURE 7.
FIGURE 7.
Caspase-insensitive ATP release stimulated by chemotherapeutic drugs is resistant to carbenoxolone blockade but suppressed by intracellular Ca2+ buffering. A, schematic of alternative ATP release pathways. When caspases are inhibited, ATP may be secreted via activation of noncleaved Panx1 channels or exocytosis of secretory lysosomes or autophagolysosomes. B and C, Jurkat T cells were incubated with no stimulus or with 3 μm STS for 8 h in the absence or presence of 100 μm Z-VAD, 500 μm CBX, or both inhibitors. Samples of the extracellular medium were processed for analysis of ATP only (B) or summed ATP + ADP + AMP (C). Data indicate mean ± S.E. for n = 6 wells from two experiments; ***, p < 0.001. D, Jurkat T cells were incubated for 1 h at 37 °C in either standard BSS (1.5 mm CaCl2) or calcium-free BSS (0 mm CaCl2) in the absence or presence 25 μm BAPTA-AM and then resuspended in fresh 1.5 calcium-BSS or 0 calcium BSS. The BAPTA-loaded or mock-loaded cells were then incubated with no stimulus or with 3 μm STS for 8 h in the absence or presence of 100 μm Z-VAD. Samples of the extracellular medium were processed for analysis of ATP. Data indicate mean ± S.E. for one experiment performed in triplicate; ns, p > 0.05; ***, p < 0.001. E and F, Jurkat T cells were incubated for 1 h at 37 °C in standard BSS (1.5 mm CaCl2) in the absence or presence 25 μm BAPTA-AM and then resuspended in fresh BSS. The BAPTA-loaded or mock-loaded cells were then incubated with no stimulus or with 3 μm STS for 8 h in the absence or presence of 100 μm Z-VAD. Samples of the extracellular medium were processed for analysis of ATP only (E) or summed ATP + ADP + AMP (F). Data indicate mean ± S.E. for n = 3 experiments; *, p < 0.05; **, p < 0.01; ***, p < 0.001. G, Jurkat cells were preincubated for 1 h in the absence or presence of 250 nm bafilomycin A (BafA), 100 μm Z-VAD, or both inhibitors. The cells were incubated for an additional 4 h with or without 3 μm STS and then assayed for LysoTracker Red accumulation. Data indicate average ± range from one experiment performed in duplicate. H, Jurkat T cells were incubated with no stimulus or with 3 μm STS for 8 h in the absence or presence of 100 μm Z-VAD, 250 nm bafilomycin A, or both inhibitors. Samples of the extracellular medium were processed for analysis of ATP. Data indicates mean ± S.E. for n = 3 experiments each performed in duplicate; ns, p > 0.05; *, p < 0.05. I, Jurkat T cells were incubated with no stimulus or with 3 μm STS for 8 h in the absence or presence of 100 μm Z-VAD, 5 mm 3-methyladenine (3MA), or both inhibitors. Samples of the extracellular medium were processed for analysis of ATP. Data indicate mean ± S.E. for n = 6 wells from two experiments; ns, p > 0.05; ***, p < 0.001.
FIGURE 8.
FIGURE 8.
Caspase-insensitive ATP release stimulated by staurosporine does not involve direct Ca2+ mobilization by staurosporine or activation of PI-PLC signaling. A–D, Jurkat cells loaded with fluo-4 Ca2+ indicator dye were assayed for changes in cytosolic [Ca2+] as described under “Experimental Procedures.” Each trace is representative of 2–5 similar test recordings from three separate batches of fluo-4-loaded cells. Where indicated in A and in all traces of B–D, the fluo-4 fluorescence signals (RFU) were assayed in the presence of 2.5 mm probenecid (prob). A and B, Ca2+ measurements were terminated by addition of Triton X-100 to release dye from all cells followed by addition of excess EGTA to indicate background Ca2+-independent fluorescence. Positive control stimuli for increasing cytosolic [Ca2+] included 10 μm ionomycin (A and B) and 1 μg/ml anti-CD3 TCR-activating antibody (B–D). D, indicated wells of Jurkat cell suspension were supplemented with 5, 10, or 20 μm U73122 PI-PLC inhibitor 15 min before stimulation with anti-CD3. E and F, Jurkat T cells were incubated with no stimulus or with 3 μm STS for 8 h in the absence or presence of 100 μm Z-VAD, 10 μm U73122, or both inhibitors. Samples of the extracellular media were processed for analysis of ATP only (E) or summed ATP + ADP + AMP (F). Data indicate mean ± S.E. for n = 6 wells from two experiments; ns, p > 0.05; ***, p < 0.001.
FIGURE 9.
FIGURE 9.
Proteosome inhibition induces caspase-3-mediated cleavage of the pannexin-1 C-terminal autoinhibitory domain and pannexin-1-mediated release of adenine nucleotides. A, Jurkat T cells were treated with no stimulus, 3 μm MG132, 3 μm STS, 20 μm Etop, or 25 μm Dox in the absence or presence of 100 μm Z-VAD or combined 100 μm Z-VAD plus 3 μm MG132 for 12 h. Aliquots were taken for Western blot analysis of Panx1, PARP1, and actin. Panx1 blots are from two separate experiments; PARP and actin blots are representative of both experiments; * indicates nonspecific immunoreactive band. B, densitometric quantification of Panx1 bands in Western blots from A; bands were normalized to the densities of the control cell samples for each experiment. C, Jurkat cells were incubated with no stimulus or 3 μm MG132 in the absence or presence of 100 μm Z-VAD. At the indicated times, samples of the extracellular medium were processed for analysis of summed ATP + ADP + AMP. Data indicate mean ± S.E. from one experiment performed in triplicate. D, Jurkat T cells were incubated with no stimulus or with 3 μm MG132 for 8 h in the absence or presence of 100 μm Z-VAD or 100 μm CBX. Samples of the extracellular medium were processed for analysis of summed ATP + ADP + AMP. Data indicate mean ± S.E. for n = 3–9 wells from three experiments; ***, p < 0.001. E and F, Jurkat T cells were incubated with no stimulus or with 3 μm MG132 for 8 h in the absence or presence of 100 μm Z-VAD. Samples of the extracellular medium were processed for analysis of YoPro accumulation (in the absence or presence or 100 μm CBX) as described in Fig. 3. E, representative phase-contrast and epifluorescence microscopy images. F, data indicate mean ± S.E. for n = 6 wells from two experiments; ***, p < 0.001.
FIGURE 10.
FIGURE 10.
Pannexin-1 is more highly expressed in human leukemic leukocytes than in normal human T cells. Left panel, whole cell lysates from Jurkat T cell lymphocytic leukemia, THP1 promonocytic leukemia, or CEM T cell lymphoblastic leukemia were processed for Western blot analysis of Panx1 and actin; * indicates nonspecific immunoreactive band. Right panel, normal human T lymphoblasts were incubated for 4 h with or without 250 ng/ml anti-Fas or 3 μm STS the absence or presence of 100 μm Z-VAD. The cells were processed for Western blot analysis of Panx1 and actin; aliquots of cell lysates from an equivalent number (106) of Jurkat cells were run on the same gel as positive controls.

Similar articles

Cited by

References

    1. Ghiringhelli F., Apetoh L., Tesniere A., Aymeric L., Ma Y., Ortiz C., Vermaelen K., Panaretakis T., Mignot G., Ullrich E., Perfettini J. L., Schlemmer F., Tasdemir E., Uhl M., Génin P., Civas A., Ryffel B., Kanellopoulos J., Tschopp J., André F., Lidereau R., McLaughlin N. M., Haynes N. M., Smyth M. J., Kroemer G., Zitvogel L. (2009) Activation of the NLRP3 inflammasome in dendritic cells induces IL-1β-dependent adaptive immunity against tumors. Nat. Med. 15, 1170–1178 - PubMed
    1. Kepp O., Tesniere A., Zitvogel L., Kroemer G. (2009) The immunogenicity of tumor cell death. Curr. Opin. Oncol. 21, 71–76 - PubMed
    1. Zitvogel L., Kepp O., Galluzzi L., Kroemer G. (2012) Inflammasomes in carcinogenesis and anticancer immune responses. Nat. Immunol. 13, 343–351 - PubMed
    1. Martins I., Michaud M., Sukkurwala A. Q., Adjemian S., Ma Y., Shen S., Kepp O., Menger L., Vacchelli E., Galluzzi L., Zitvogel L., Kroemer G. (2012) Premortem autophagy determines the immunogenicity of chemotherapy-induced cancer cell death. Autophagy 8, 413–415 - PubMed
    1. Michaud M., Martins I., Sukkurwala A. Q., Adjemian S., Ma Y., Pellegatti P., Shen S., Kepp O., Scoazec M., Mignot G., Rello-Varona S., Tailler M., Menger L., Vacchelli E., Galluzzi L., Ghiringhelli F., di Virgilio F., Zitvogel L., Kroemer G. (2011) Autophagy-dependent anticancer immune responses induced by chemotherapeutic agents in mice. Science 334, 1573–1577 - PubMed

Publication types

MeSH terms

LinkOut - more resources