. 2014 Aug 11:4:6010.
doi: 10.1038/srep06010.

The crucial role of Atg5 in cortical neurogenesis during early brain development

Affiliations

The crucial role of Atg5 in cortical neurogenesis during early brain development

Xiaohui Lv et al. Sci Rep. .

Abstract

Autophagy plays an important role in the central nervous system. However, it is unknown how autophagy regulates cortical neurogenesis during early brain development. Here, we report that autophagy-related gene 5 (Atg5) expression increased with cortical development and differentiation. The suppression of Atg5 expression by knockdown led to inhibited differentiation and increased proliferation of cortical neural progenitor cells (NPCs). Additionally, Atg5 suppression impaired cortical neuronal cell morphology. We lastly observed that Atg5 was involved in the regulation of the β-Catenin signaling pathway. The β-Catenin phosphorylation level decreased when Atg5 was blocked. Atg5 cooperated with β-Catenin to modulate cortical NPCs differentiation and proliferation. Our results revealed that Atg5 has a crucial role in cortical neurogenesis during early embryonic brain development, which may contribute to the understanding of neurodevelopmental disorders caused by autophagy dysregulation.


Figures

Figure 1
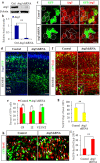
Figure 1. Atg5 expression in the embryonic cerebral cortex.
(a). A western blot shows the protein level of Atg5 in the mouse cortex during embryonic development. β-actin was used as a control. Blot images were cropped for comparison. (b). The bar graph shows the relative band intensity of Atg5 from embryonic day 10 to 16 (E10–E16). (c). The expression of Atg5 in the developing cortex. CP, cortical plate; IZ, intermediate zone; SVZ, subventricular zone; VZ, ventricular zone. Boxed areas are enlarged in the bottom. (d). Atg5 is co-localized with Sox2 in the VZ/SVZ of E15 brain sections. Boxed areas are enlarged in the bottom. (e). The protein levels of Atg5 and Tuj1were determined by a western blot in mouse neural stem cells over 7 days of differentiation. β-actin was used as a control. Blot images were cropped for comparison. (f, g).The bar graphs show the relative band intensity of Atg5 (f) and Tuj1 (g) in mouse neural stem cells during a differentiation time course. Scale bars, 50 μm (c and d).
Figure 2
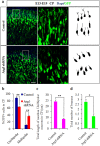
Figure 2. Atg5 regulates cortical NPCs differentiation and proliferation.
(a). Control or Atg5 shRNA plasmids were transfected into HEK 293FT cells, and Atg5 protein levels were then analyzed using a western blot. Ctrl, Atg5-expression plasmids plus control shRNA plasmids; Atg5 shRNA, Atg5-expression plasmids plus Atg5 shRNA plasmids. β-actin was used as a control. Blot images were cropped for comparison. (b). The bar graph shows the relative band intensity of Atg5 compared to the control. (c). Atg5 expression is knocked down in vivo after Atg5 shRNA plasmid electroporation. Electroporated embryonic brain sections were stained with an Atg5 antibody. The circled cells are GFP-positive cells. (d). Atg5 knockdown changes the cells' positions in the cortex. The control or Atg5 shRNA plasmids were electroporated into the embryonic brains at E13 and harvested at E16. (e). The GFP-positive cell percentages are shown in each region of the cortex. (f). Reduced cortical neuronal differentiation in Atg5 knockdown brains. The E16 brain sections were stained with anti-Tuj1 antibody. Inset shows zoom view of colocalization cells in control and Atg5 shRNA groups. Arrows indicate GFP-Tuj1 double positive cells; Arrowheads indicate GFP+Tuj1− cells. (g). The quantification percentage of GFP-Tuj1 double positive cells relative to total GFP-positive cells is shown. (h). Atg5 knockdown causes increased BrdU incorporation in vivo. BrdU (100 mg/kg) was injected into mice 2 hours before sacrifice. The arrows indicate GFP-BrdU double positive cells. (i). The quantification percentage of GFP-BrdU double positive cells relative to total GFP positive cells is shown. Scale bars, 10 μm (c), 50 μm (d and f), and 20 μm (h).
Figure 3
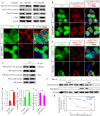
Figure 3. Atg5 knockdown impairs the morphology of cortical neurons.
(a). Abnormal morphology of cortical neurons caused by Atg5 knockdown. Control or Atg5 shRNA plasmids were electroporated into E13 brains, and the brain sections were analyzed at E19. (b). The quantification percentage of GFP-positive uni/biopolar or multipolar neurons relative to total GFP positive cells in the cortical plate is shown. (c). The total lengths of uni/biopolar neuron neurites in the cortical plate are shown. (d). The total number of branches of neurons in the cortical plate is shown. Scale bars, 50 μm (a).
Figure 4
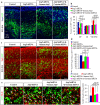
Figure 4. Atg5 regulates the β-Catenin signaling pathway.
(a). The effect of Atg5 on the expression of β-Catenin. HEK293FT cells were transfected with Atg5 shRNA, Atg5-expression or control plasmids. Ctrl, Atg5-expression plasmids plus control shRNA plasmids; Atg5 KD, Atg5-expression plasmids plus Atg5 shRNA plasmids; Ctrl', Atg5-expression vector plasmids; Atg5 OE, Atg5-expression plasmids. A western blot was used to analyze the β-Catenin protein levels 3 days later. β-actin was used as a control. Blot images were cropped for comparison. (b). Co-immunostaining shows that the expression of non-pS33/37/T41 β-Catenin increases after Atg5 knockdown. Control or Atg5 shRNA plasmids were transfected into HEK 293FT cells. (c). The expression of LC3 decreases after Atg5 knockdown. Control or Atg5 shRNA plasmids were transfected into HEK 293FT cells. (d). Co-immunostaining shows the expression of pS33/37/T41 β-Catenin and GFP-LC3 in 293FT cells under normal or starvation conditions (in HBSS solution) for 6 hr. (e). LC3 interacts with β-Catenin. Control or LC3 plasmids were transfected into HEK 293FT cells. The transfected cell lysates were subjected to co-immunoprecipitation (co-IP) using an anti-LC3 antibody and immunoblotted with anti-pS33/37/T41 β-Catenin and anti-total β-Catenin antibodies. Input lysates are shown. β-actin was used as a control. Blot images were cropped for comparison. (f). Effects of Atg5 on stability of β-Catenin protein. Flag-Atg5 or empty vector was overexpressed in primary neural stem cells under differentiation conditions. Cycloheximide (CHX, 100 μg/mL) was added after 48 hours. The cells lysates were harvested at the indicated times and immunoblotted with anti-total β-Catenin, anti-flag, and anti-β-actin antibodies. (g). The graph shows the relative band intensity of total β-Catenin relative to the level of β-actin at each time point, compared with the level of β-Catenin at time zero, taken as 1. (h, i, j). Atg5 regulates the downstream target genes (cyclin D1, c-Myc, and neurogenin 2 (Ngn2)) expression of β-Catenin. Primary neural stem cells were infected with control and Atg5 shRNA lentivirus. The cells were harvested after 3 days for real-time PCR. Scale bars, 2 μm (b–d).
Figure 5
Figure 5. Atg5 cooperates with β-Catenin to mediate cortical NPCs differentiation and proliferation.
(a). Defects of cell position caused by Atg5 shRNA are rescued by human Atg5 overexpression or β-Catenin knockdown. (b).The quantification of GFP-positive cells percentage is shown in each region of the cortex. (c). The decreased neuronal differentiation induced by Atg5 shRNA is rescued by human Atg5 overexpression or β-Catenin knockdown. (d).The quantification percentage of GFP-Tuj1 double positive cells to total GFP-positive cells is shown. (e). Increased BrdU incorporation caused by Atg5 knockdown is rescued by human Atg5 overexpression or β-Catenin knockdown in VZ. The arrows indicate double positive cells for GFP and BrdU. (f). The quantification percentage of GFP-BrdU double positive cells to total GFP positive cells is shown. Scale bars, 50 μm (a and c) and 20 μm (e).

Similar articles

Cited by

References

    1. Angevine J. B. Jr & Sidman R. L. Autoradiographic study of cell migration during histogenesis of cerebral cortex in the mouse. Nature 192, 766–768 (1961). - PubMed
    1. Temple S. & Qian X. Vertebrate neural progenitor cells: subtypes and regulation. Curr Opin Neurobiol 6, 11–17 (1996). - PubMed
    1. Levine B. & Kroemer G. Autophagy in the pathogenesis of disease. Cell 132, 27–42 (2008). - PMC - PubMed
    1. Mizushima N. & Levine B. Autophagy in mammalian development and differentiation. Nat Cell Biol 12, 823–830 (2010). - PMC - PubMed
    1. Xie Z. & Klionsky D. J. Autophagosome formation: core machinery and adaptations. Nat Cell Biol 9, 1102–1109 (2007). - PubMed

Publication types

MeSH terms

LinkOut - more resources