Modeling of scale-dependent bacterial growth by chemical kinetics approach
- PMID: 25105169
- PMCID: PMC4106075
- DOI: 10.1155/2014/820959
Modeling of scale-dependent bacterial growth by chemical kinetics approach
Abstract
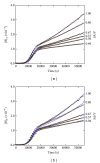
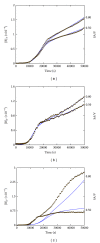
We applied the so-called chemical kinetics approach to complex bacterial growth patterns that were dependent on the liquid-surface-area-to-volume ratio (SA/V) of the bacterial cultures. The kinetic modeling was based on current experimental knowledge in terms of autocatalytic bacterial growth, its inhibition by the metabolite CO2, and the relief of inhibition through the physical escape of the inhibitor. The model quantitatively reproduces kinetic data of SA/V-dependent bacterial growth and can discriminate between differences in the growth dynamics of enteropathogenic E. coli, E. coli JM83, and Salmonella typhimurium on one hand and Vibrio cholerae on the other hand. Furthermore, the data fitting procedures allowed predictions about the velocities of the involved key processes and the potential behavior in an open-flow bacterial chemostat, revealing an oscillatory approach to the stationary states.
Figures


Similar articles
-
Efficacy of solar disinfection of Escherichia coli, Shigella flexneri, Salmonella Typhimurium and Vibrio cholerae.J Appl Microbiol. 2006 Oct;101(4):828-36. doi: 10.1111/j.1365-2672.2006.02983.x. J Appl Microbiol. 2006. PMID: 16968294
-
Antibacterial activity of Lactobacillus species against Vibrio species.Microbiol Res. 1998 Nov;153(3):271-5. doi: 10.1016/s0944-5013(98)80011-6. Microbiol Res. 1998. PMID: 9880930
-
Abundance of pathogenic Escherichia coli, Salmonella typhimurium and Vibrio cholerae in Nkonkobe drinking water sources.J Water Health. 2006 Sep;4(3):289-96. doi: 10.2166/wh.2006.011. J Water Health. 2006. PMID: 17036837
-
Comparison of the structure and regulation of the udp gene of Vibrio cholerae, Yersinia pseudotuberculosis, Salmonella typhimurium, and Escherichia coli.Res Microbiol. 2003 Sep;154(7):510-20. doi: 10.1016/S0923-2508(03)00125-6. Res Microbiol. 2003. PMID: 14499937
-
Review lecture on the growth and form of a bacterial cell.Philos Trans R Soc Lond B Biol Sci. 1974 Feb 21;267(886):303-36. doi: 10.1098/rstb.1974.0003. Philos Trans R Soc Lond B Biol Sci. 1974. PMID: 4150667 Review. No abstract available.
References
-
- Epstein IR, Pojman JA. An Introduction to Nonlinear Chemical Dynamics: Oscillations, Waves, Patterns and Chaos. New York, NY, USA: Oxford University Press; 1998.
-
- Strogatz SH. Nonlinear Dynamics and Chaos: With Applications to Physics , Biology, Chemistry, and Engineering. Cambridge, Mass, USA: Perseus; 1994.
-
- Taub IA, Feeherry FE, Ross EW, Kustin K, Doona CJ. A quasi-chemical kinetics model for the growth and death of Staphylococcus aureus in intermediate moisture bread. Journal of Food Science. 2003;68(8):2530–2537.
-
- Doona CJ, Feeherry FE, Ross EW. A quasi-chemical model for the growth and death of microorganisms in foods by non-thermal and high-pressure processing. International Journal of Food Microbiology. 2005;100(1–3):21–32. - PubMed
-
- Ross EW, Taub IA, Doona CJ, Feeherry FE, Kustin K. The mathematical properties of the quasi-chemical model for microorganism growth-death kinetics in foods. International Journal of Food Microbiology. 2005;99(2):157–171. - PubMed
Publication types
MeSH terms
Substances
LinkOut - more resources
Full Text Sources
Other Literature Sources

