. 2014 Oct 9;124(15):2431-41.
doi: 10.1182/blood-2014-04-569707. Epub 2014 Aug 1.

CEACAM2 negatively regulates hemi (ITAM-bearing) GPVI and CLEC-2 pathways and thrombus growth in vitro and in vivo

Affiliations

CEACAM2 negatively regulates hemi (ITAM-bearing) GPVI and CLEC-2 pathways and thrombus growth in vitro and in vivo

Musaed M Alshahrani et al. Blood. .

Abstract

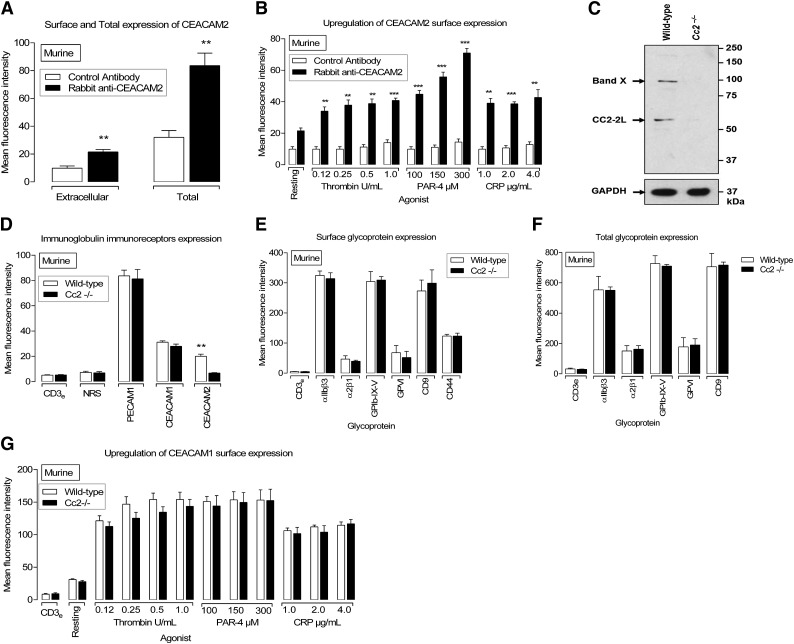
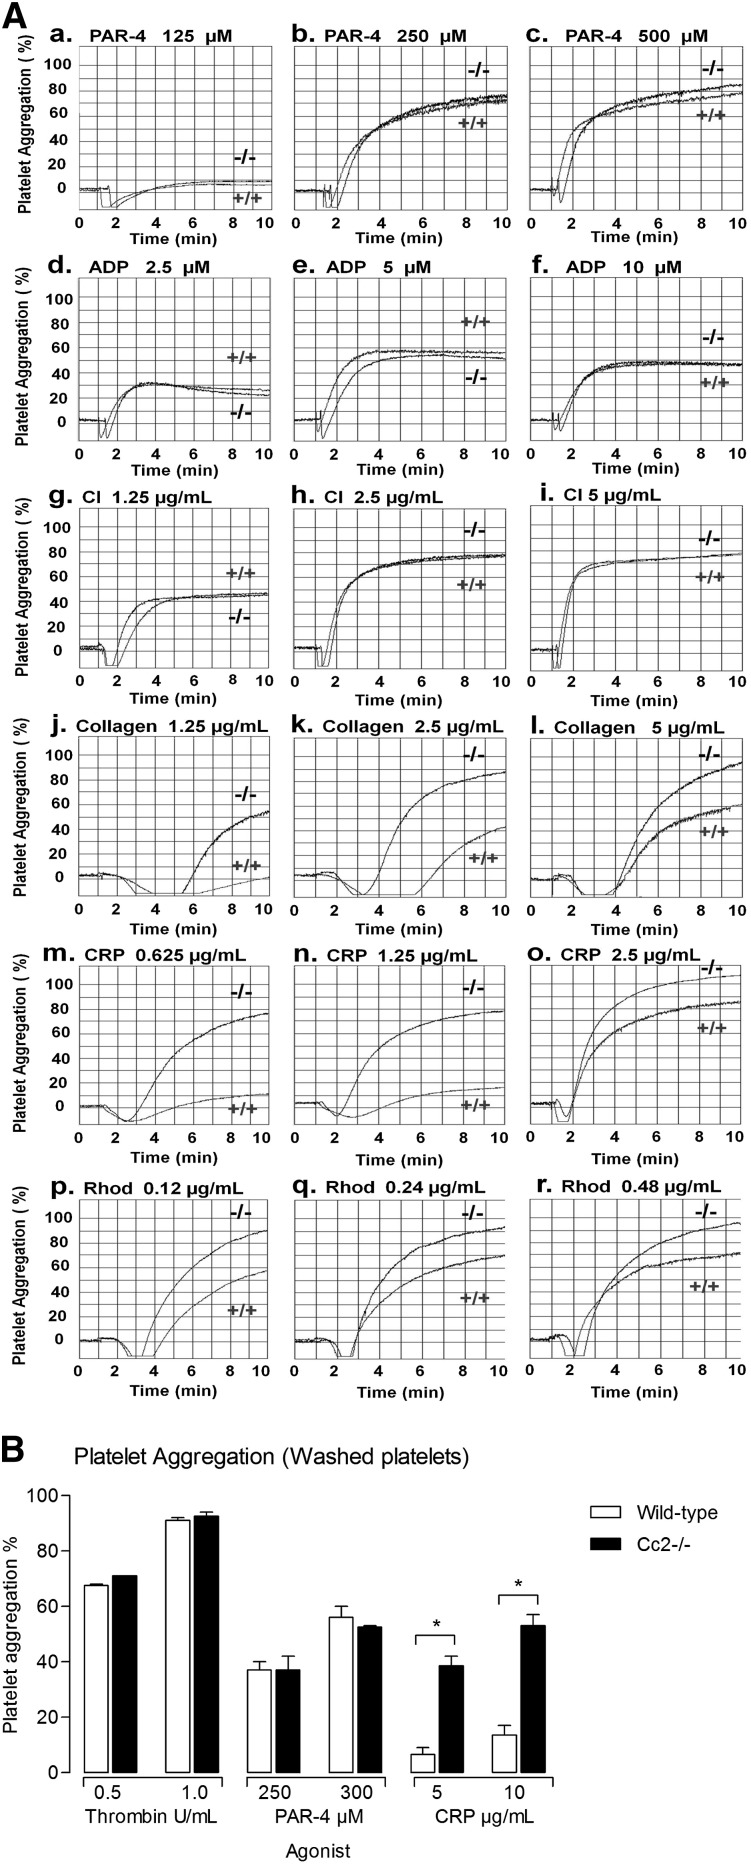
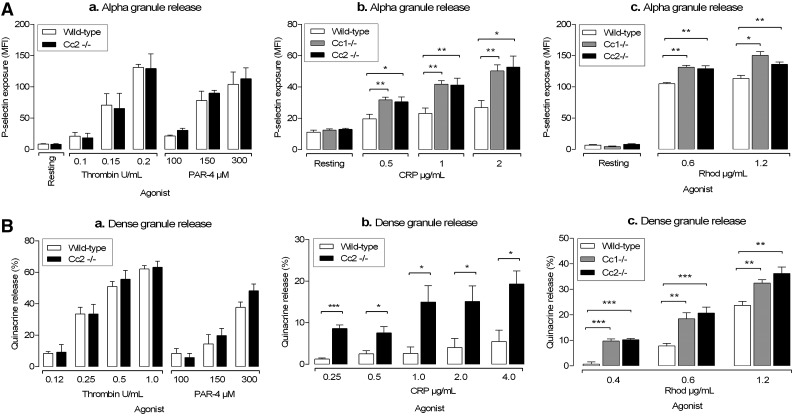
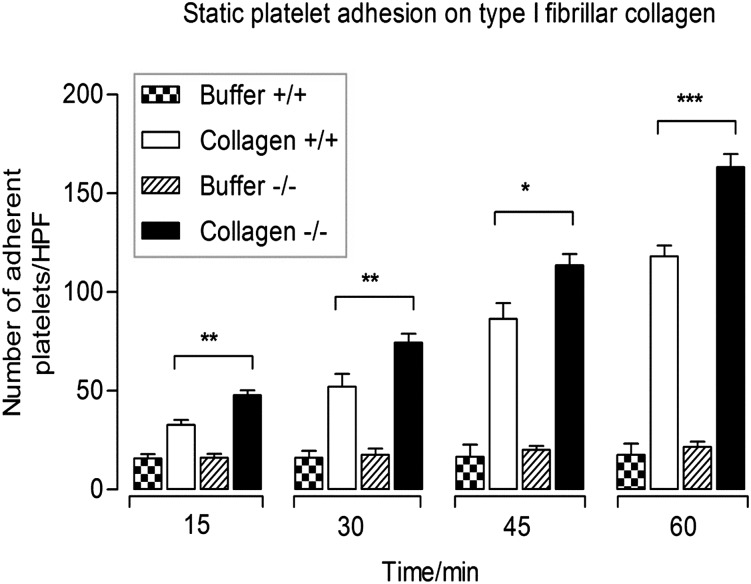
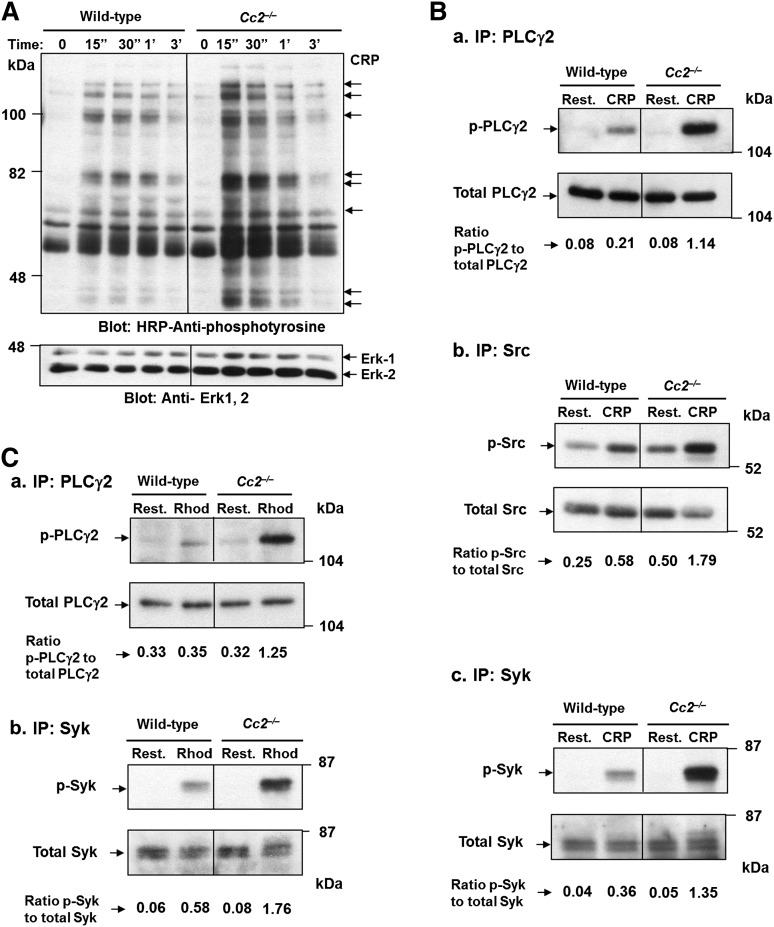
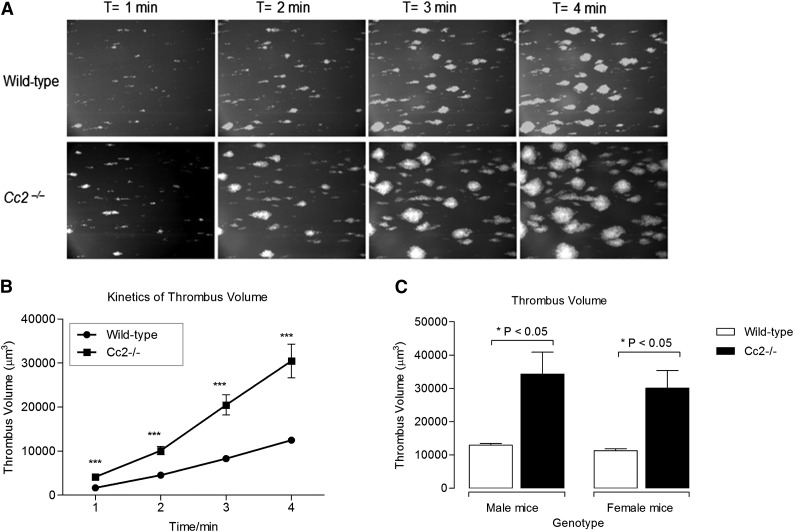
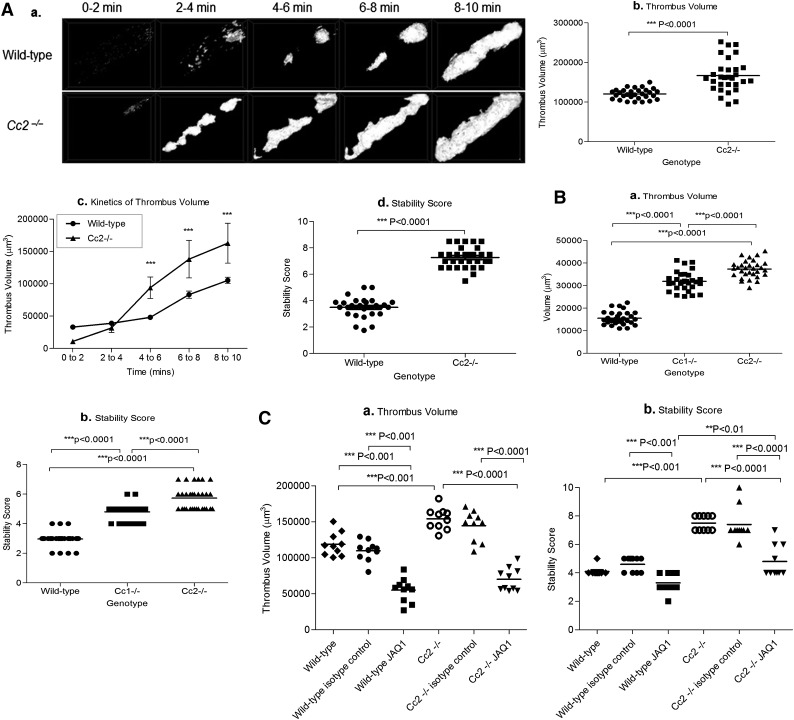
Carcinoembryonic antigen-related cell adhesion molecule-2 (CEACAM2) is a cell-surface glycoprotein expressed on blood, epithelial, and vascular cells. CEACAM2 possesses adhesive and signaling properties mediated by immunoreceptor tyrosine-based inhibitory motifs. In this study, we demonstrate that CEACAM2 is expressed on the surface and in intracellular pools of platelets. Functional studies of platelets from Ceacam2(-/-)-deficient mice (Cc2(-/-)) revealed that CEACAM2 serves to negatively regulate collagen glycoprotein VI (platelet) (GPVI)-FcRγ-chain and the C-type lectinlike receptor 2 (CLEC-2) signaling. Cc2(-/-) platelets displayed enhanced GPVI and CLEC-2-selective ligands, collagen-related peptide (CRP), collagen, and rhodocytin (Rhod)-mediated platelet aggregation. They also exhibited increased adhesion on type I collagen, and hyperresponsive CRP and CLEC-2-induced α and dense granule release compared with wild-type platelets. Furthermore, using intravital microscopy to ferric chloride (FeCl3)-injured mesenteric arterioles and laser-induced injury of cremaster muscle arterioles, we herein show that thrombi formed in Cc2(-/-) mice were larger and more stable than wild-type controls in vivo. Thus, CEACAM2 is a novel platelet immunoreceptor that acts as a negative regulator of platelet GPVI-collagen interactions and of ITAM receptor CLEC-2 pathways.


Figures

Figure 1
Figure 1
CEACAM2 is expressed on the surface and in intracellular pools in murine platelets. (A) Flow cytometric analysis of CEACAM2 surface and total expression on resting murine platelets. Platelets were stained with a polyclonal anti-murine CEACAM2 2052 antibody followed by a secondary PE-conjugated anti-rabbit antibody. Normal rabbit serum was included as a negative control. For total expression, platelets were resuspended in 0.1% (wt/vol) saponin and then washed with a combination of 0.1% (wt/vol) saponin and 0.2% (wt/vol) bovine serum albumin. Data were collected by a live platelet gate based on forward vs side scatter profiles on a FACS Canto II flow cytometer. Results are cumulative data derived from 4 independent experiments and represented as mean fluorescence intensity (MFI) ± SEM (**P < .01; n = 4). (B) CEACAM2 surface expression upon agonist stimulation of murine platelets using thrombin (0.125-1.0 U/mL), PAR-4 agonist peptide (100-300 µM), and collagen-related peptide (CRP; 1.0-4.0 µg/mL) over a dose-dependent range (**P < .01 and ***P < .001; n = 4). CEACAM2 surface expression was determined as described in (A). (C) Platelet lysates from wild-type and Cc2−/− mice were analyzed by 10% sodium dodecyl sulfate polyacrylamide gel electrophoresis (SDS-PAGE) and western blotting using 1:2000 of rabbit anti-mouse CEACAM2 polyclonal antibody (2052) (upper panel), followed by reprobing with GAPDH antibody to control for protein loading (bottom panel). A ∼52-kDa band representing CEACAM2 and another one (band X) at ∼95kDa representing an unidentified protein were detected. (D) Flow cytometric analysis of PECAM-1, CEACAM1, and CEACAM2 expression on resting wild-type vs Cc2−/− platelets. Wild-type and Cc2−/− platelets were stained with a monoclonal anti-murine PECAM-1 antibody, polyclonal anti-murine CEACAM1 2457 antibody, or polyclonal anti-murine CEACAM2 2052 antibody followed by a secondary PE-conjugated anti-rat or anti-rabbit antibody. Normal rabbit serum (NRS) and isotype control antibody CD3 were included as negative controls. Data were collected by a live platelet gate based on forward vs side scatter profiles on a FACS Canto II flow cytometer. Results are cumulative data derived from 4 independent experiments and represented as MFI ± SEM (**P < .01; n = 4). (E) Cell-surface expression of platelet glycoproteins was monitored by flow cytometry using specific monoclonal antibodies for wild-type and Cc2−/− platelets. Platelets were preincubated with anti-mouse integrin β3, CD61 (10 µg/mL), anti-mouse integrin α2β1, CD49b (15 µg/mL), anti-mouse GPIbα/IX/V, CD42b (10 µg/mL), anti-mouse CD44 (10 µg/mL), anti-mouse GPVI (10 µg/mL), and anti-mouse CD9 (10 µg/mL). MFI was reported with an SEM for at least 4 independent experiments and no significant difference demonstrated. (F) Total expression of platelet glycoproteins on resting wild-type and Cc2−/− murine platelets was determined as described in (A). Antibodies concentrations were described in (E). (G) Cell-surface expression of CEACAM1 upon agonist stimulation of wild-type vs Cc2−/− murine platelets was determined as described in (B).
Figure 2
Figure 2
Cc2−/− platelets are hyperresponsive to stimulation with type I collagen, GPVI, and CLEC-2–selective agonists, CRP and Rhod. (A) Aggregation responses of PRP (platelet count adjusted to 1 × 10⁸/mL) for wild-type (+/+) and Cc2−/− mice were determined after stimulation with the following agonists: (a-c) PAR-4 agonist peptide (125-500 µM); (d-f) ADP (2.5-10 µM); (g-i) calcium ionophore (1.25-5 µg/mL); (j-l) type I collagen (1.25-5 µg/mL); (m-o) CRP (0.625-2.5 µg/mL); and (p-r) Rhod (0.12-0.48 µg/mL). Note that Cc2−/− platelets are hyperresponsive to stimulation by type I collagen, GPVI, and CLEC-2selective agonists, CRP and Rhod. These data are representative of at least 4 independent experiments performed. (B) Aggregation responses of washed platelets for wild-type and Cc2−/− mice were determined after stimulation with the following agonists: thrombin (0.25-1 U/mL), PAR-4 agonist peptide (250-500 µM), and CRP (5-10 µg/mL). Note that Cc2−/− platelets are hyperresponsive to stimulation by GPVI-selective agonist, CRP.
Figure 3
Figure 3
Cc2−/− platelets display enhanced α and dense granule release after stimulation with GPVI and CLEC-2–selective agonists, CRP and Rhod. (A) Surface expression of P-selectin as a marker of α granule release was determined for washed platelets stimulated by several agonists: (a) Thrombin (0.125-0.25 U/mL), PAR-4 agonist peptide (100-300 µM), (b) CRP (0.5-2.0 µg/mL), and (c) Rhod (0.6-1.2 µg/mL). Then they were stained with FITC-conjugated P-selectin mAb for wild-type, Cc1−/−, and Cc2−/− platelets. FITC-labeled samples were analyzed on an FACS Canto II flow cytometer. Results are representative of 3 independent experiments (*P < .05, **P < .01; n = 4). (B) Platelet-dense granule exocytosis measured by release of fluorescent quinacrine by flow cytometry. Washed platelets (1 × 10⁸/mL) were derived from both wild-type and Cc2−/− mice and were stimulated with either no agonist or agonist. (a) Thrombin (0.125-1.0 U/mL) or PAR-4 agonist peptide (100-300 µM) or (b) CRP (0.25-4.0 µg/mL). (c) Wild-type, Cc1−/−, and Cc2−/− platelets were stimulated by Rhod (0.4-1.2 µg/mL). Samples were analyzed on an FACS Canto II flow cytometer. Data are reported as percentage quinacrine release and are representative of 4 independent experiments (*P < .05, **P < .01, ***P < .001; n = 4).
Figure 4
Figure 4
Cc2−/− platelets display enhanced static adhesion on immobilized type I collagen. Time course of wild-type and Cc2−/− platelet adhesion to either buffer control or type I collagen (50 µg/mL) in the absence of magnesium for 15, 30, 45, and 60 minutes at 37°C. Nonadherent platelets were removed and adherent platelets were measured as described in Materials and methods. The data represent 4 independent experiments. Note that Cc2−/− platelets show a higher level of platelet adhesion to type I fibrillar collagen than wild-type platelets (+/+) at all time points (*P < .05, **P < .01, ***P < .001; n = 4).
Figure 5
Figure 5
Cc2−/− platelets show hyperphosphorylated proteins after GPVI and CLEC-2–selective agonists, CRP and Rhod, stimulation over time. (A) Platelets (3 × 10⁸/mL) from wild-type and Cc2−/− mice were stimulated with 10 µg/mL of CRP at 37 °C for 3 minutes. Platelet lysate of 30 µg was then loaded onto a 10% (wt/vol) SDS-PAGE gel. Then western blotting was performed to measure tyrosine phosphorylation using 1:5000 of HRP-conjugated anti-phosphotyrosine RC20 antibody. A protein-loading control (bottom panel) blot was stripped and reprobed using anti-Erk-1/2 Ab for detection of Erk-1 and -2 antigens. The data shown are a representative blot of similar results for 3 independent experiments. (B) Tyrosine phosphorylation of PLCγ2, Src, and Syk was detected from platelet lysate after stimulation with 10 µg/mL of CRP vs resting at time 0 and 90 seconds. Immunoprecipitation of PLCγ2, Src, and Syk from platelet lysates was performed followed by immunoblotting to detect (a) p-PLCγ2, using 1:5000 of an HRP-conjugated anti-phosphotyrosine RC20 antibody, (b) p-Src, using 1:2000 of antiphospho Src and 1:20 000 of anti-rabbit, and (c) p-Syk, using 1:20 000 of an HRP-conjugated anti-phosphotyrosine 4G10 antibody. PLCγ2, Src, and Syk antigens (bottom panel; a-c) loading control were confirmed by reprobing with polyclonal anti-PLCγ2, anti-Src, and anti-Syk antibodies, respectively. The relative intensity of tyrosine-phosphorylated PLCγ2, Src, and Syk was quantified by ImageJ software, version 1.46r. The data shown are a representative blot of similar results for 3 independent experiments. (C) Tyrosine phosphorylation of PLCγ2 and Syk was detected from platelet lysate after stimulation with 1.2 µg/mL of Rhod vs resting at time 0 and 90 seconds as described in (B).
Figure 6
Figure 6
Cc2−/− platelets display greater adhesion and thrombus formation under arterial flow on immobilized type I collagen. (A-C) Rhodamine-labeled whole blood of wild-type and Cc2−/− mice was perfused over 500 µg/mL type I fibrillar collagencoated µ-slide III0.1 at a shear wall flow rate of 1800 s−1. Z-stack images were recorded over 4 minutes with a Zeiss Axiovert microscope captured with Axiocam MRm camera and analyzed using Zeiss Axiovision Rel4.6 software. Thrombi formed were analyzed by deconvolution and 3-D reconstructions. (A) Images of in vitro thrombus formation under arterial flow on immobilized type I fibrillar collagen for both wild-type and Cc2−/− platelets over 4 minutes. (B) Kinetics of thrombus volume (µm3) over time was derived by multiplying thrombus area (µm2) with thrombus height (µm) for both wild-type and Cc2−/− platelets (30 480 ± 3822 vs 12 480 ± 588.2 µm3; ***P < .001; at 4 minutes; n = 10). (C) Thrombus volume (µm3) data from (B) was stratified according to sex, both male and female, for both wild-type and Cc2−/− platelets at the 4-minutes time point (*P < .05; n = 5 per group).
Figure 7
Figure 7
Cc2−/− mice display larger and more stable thrombi in vivo. (Aa) Z-stack thrombus formation images of FeCl3-induced vascular injury was monitored in arterioles of wild-type vs Cc2−/− mice over 10 minutes. The different lengths of time after FeCl3 application are specified. Note that thrombi are larger in Cc2−/− arterioles over time compared with wild-type control arterioles (n = 30). (b) Quantitative analysis of arterial thrombogenesis of wild-type (●) vs Cc2−/− (▪) arterioles. Cc2−/− arterioles displayed a significantly larger thrombus volume at 10 minutes compared with wild-type arterioles (166 900 ± 7601 vs 120500 ± 2390 µm3; ***P < .0001; n = 30). (c) The kinetics of thrombus volume of wild-type vs Cc2−/− arterioles over time was reliably measured. Cc2−/− arterioles were significantly increased at 4 to 10 minutes compared with wild-type arterioles. (d) The thrombus stability was scored from 1 to 10, with 1 being 0% to 10% occupancy and 10 being 91% to 100% occupancy (ie, complete vessel occlusion) visualized over time. Cc2−/− arterioles showed greater stability in thrombi formed (7.267 ± 0.143 vs 3.493 ± 0.136; ***P < .0001; n = 30). (Ba-b) Platelet thrombus formation in response to laser-induced injury in wild-type, Cc1−/−, and Cc2−/− arterioles. Thrombus volume in Cc2−/− and Cc1−/− arterioles was significantly greater than wild-type arterioles (37 355 ± 702.6 vs 31 956 ± 785.1 vs 15 578 ± 543.7, respectively; ***P < .0001; n = 30) and displayed greater stability in thrombi formed (5.733 ± 0.143 vs 4.80 ± 0.010 vs 2.967 ± 0.0894, respectively; ***P < .0001; n = 30). (Ca-b) Thrombus formation in response to FeCl3 after inhibition of mouse GPVI with specific monoclonal antibody (mAb) JAQ1 administration to wild-type and Cc2−/− mice compared with control IgG-treated wild-type and Cc2−/− or untreated wild-type and Cc2−/− mice. Compared with untreated Cc2−/− or control IgG-treated Cc2−/− arterioles, JAQ1-treated Cc2−/− arterioles displayed around a twofold smaller thrombus volume at 10 minutes (154 300 ± 4741 vs 144 600 ± 6613 vs 70 050 ± 5077 µm3, respectively; ***P < .0001; n = 10 arterioles from 3 mice per group) and around a twofold lower stability score at 10 minutes (7.500 ± 0.166 vs 7.400 ± 0.371 vs 4.800 ± 0.359, respectively; ***P < .0001; n = 10 arterioles from 3 mice per group). In contrast, compared with untreated wild-type or control IgG-treated wild-type arterioles, JAQ1-treated wild-type arterioles displayed around a threefold smaller thrombus volume at 10 minutes (118 700 ± 5102 vs 109 800 ± 4497 vs 55 080 ± 5269 µm3, respectively; ***P < .0001; n = 10 arterioles from 3 mice per group) and a moderately lower stability score at 10 minutes (4.100 ± 0.100 vs 4.600 ± 0.163 vs 3.300 ± 0.213, respectively; **P < .01; n = 10 arterioles from 3 mice per group).

Comment in

Similar articles

Cited by

References

    1. Jones CI, Barrett NE, Moraes LA, Gibbins JM, Jackson DE. Endogenous inhibitory mechanisms and the regulation of platelet function. Methods Mol Biol. 2012;788:341–366. - PubMed
    1. Jones KL, Hughan SC, Dopheide SM, Farndale RW, Jackson SP, Jackson DE. Platelet endothelial cell adhesion molecule-1 is a negative regulator of platelet-collagen interactions. Blood. 2001;98(5):1456–1463. - PubMed
    1. Patil S, Newman DK, Newman PJ. Platelet endothelial cell adhesion molecule-1 serves as an inhibitory receptor that modulates platelet responses to collagen. Blood. 2001;97(6):1727–1732. - PubMed
    1. Cicmil M, Thomas JM, Leduc M, Bon C, Gibbins JM. Platelet endothelial cell adhesion molecule-1 signaling inhibits the activation of human platelets. Blood. 2002;99(1):137–144. - PubMed
    1. Dhanjal TS, Ross EA, Auger JM, et al. Minimal regulation of platelet activity by PECAM-1. Platelets. 2007;18(1):56–67. - PMC - PubMed

Publication types

MeSH terms