. 2014 Aug;42(14):8954-69.
doi: 10.1093/nar/gku611. Epub 2014 Jul 23.

Acute hypoxia affects P-TEFb through HDAC3 and HEXIM1-dependent mechanism to promote gene-specific transcriptional repression

Affiliations

Acute hypoxia affects P-TEFb through HDAC3 and HEXIM1-dependent mechanism to promote gene-specific transcriptional repression

Olga S Safronova et al. Nucleic Acids Res. 2014 Aug.

Abstract

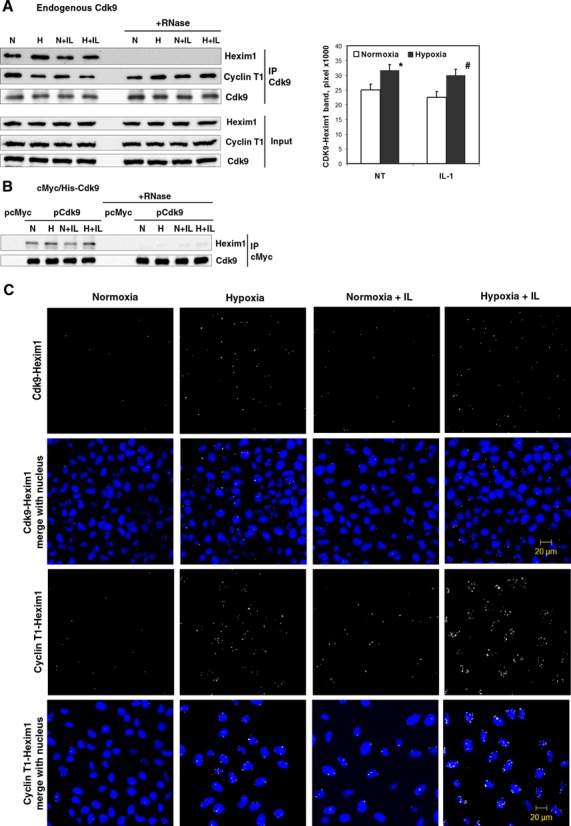
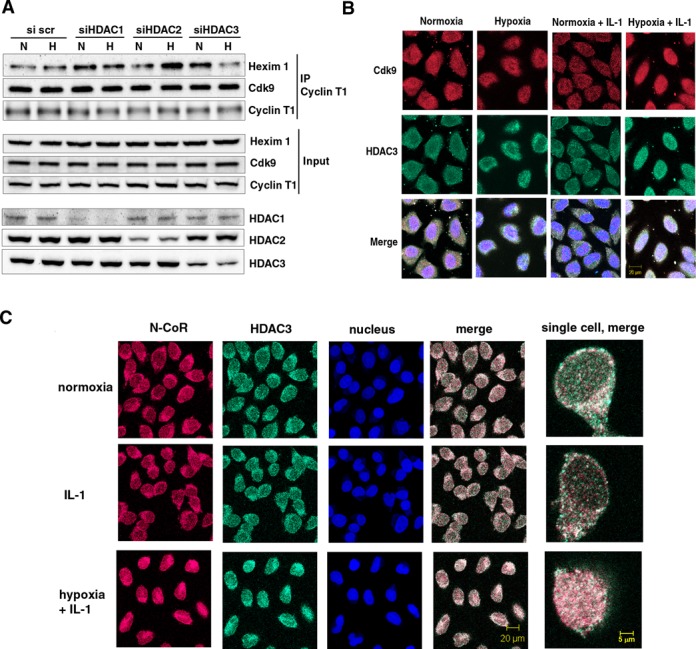
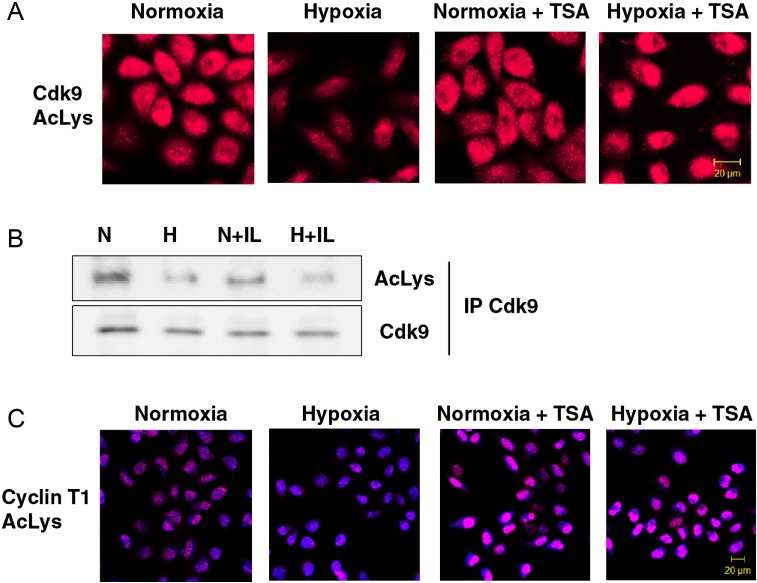
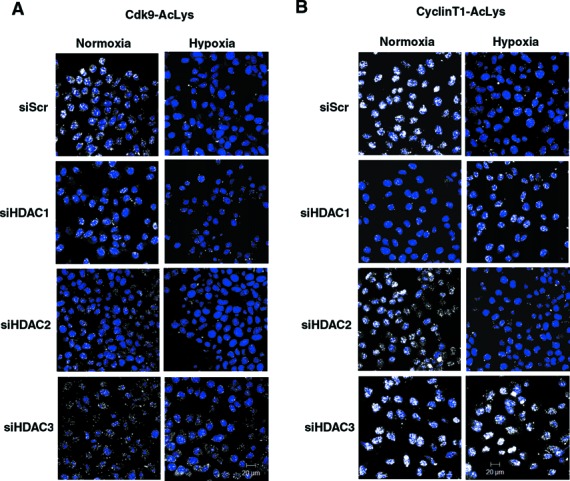
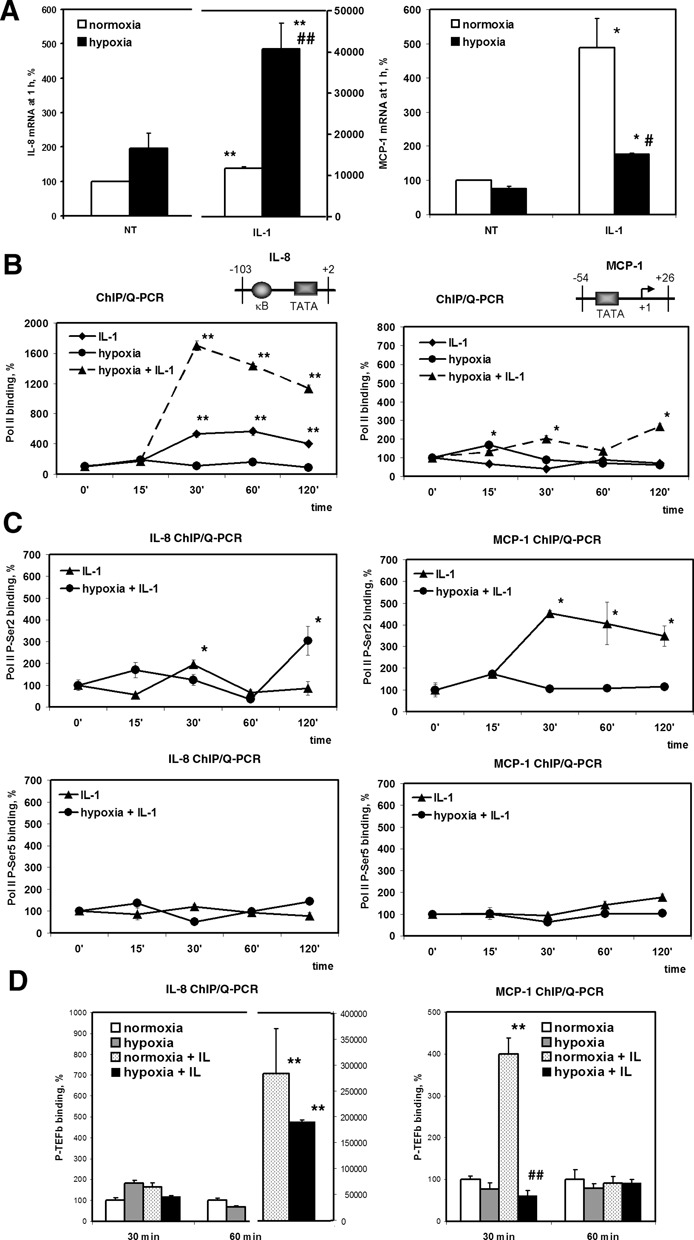
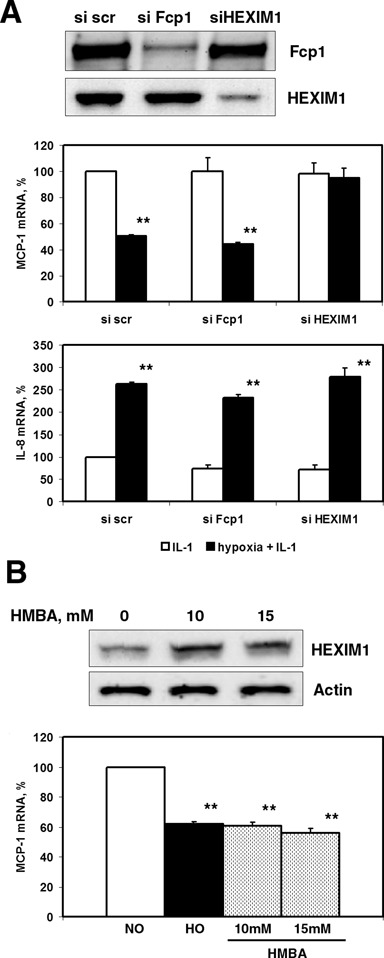
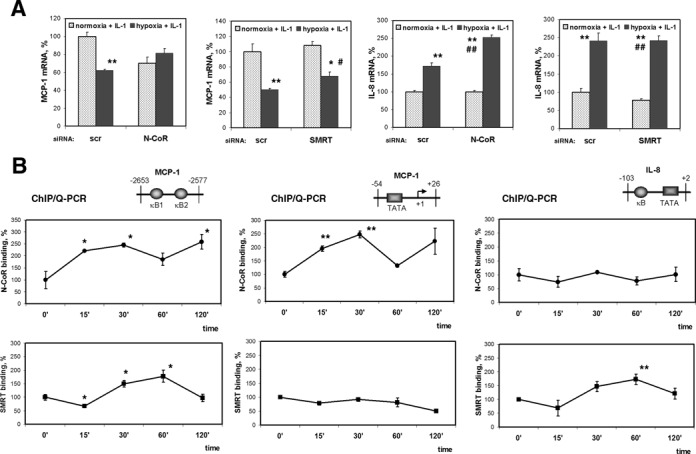
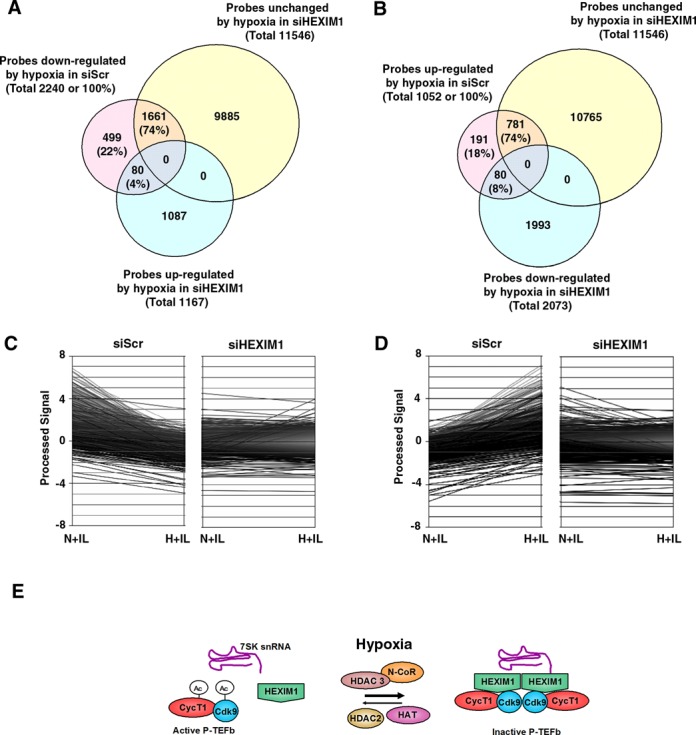
Hypoxia is associated with a variety of physiological and pathological conditions and elicits specific transcriptional responses. The elongation competence of RNA Polymerase II is regulated by the positive transcription elongation factor b (P-TEFb)-dependent phosphorylation of Ser2 residues on its C-terminal domain. Here, we report that hypoxia inhibits transcription at the level of elongation. The mechanism involves enhanced formation of inactive complex of P-TEFb with its inhibitor HEXIM1 in an HDAC3-dependent manner. Microarray transcriptome profiling of hypoxia primary response genes identified ∼79% of these genes being HEXIM1-dependent. Hypoxic repression of P-TEFb was associated with reduced acetylation of its Cdk9 and Cyclin T1 subunits. Hypoxia caused nuclear translocation and co-localization of the Cdk9 and HDAC3/N-CoR repressor complex. We demonstrated that the described mechanism is involved in hypoxic repression of the monocyte chemoattractant protein-1 (MCP-1) gene. Thus, HEXIM1 and HDAC-dependent deacetylation of Cdk9 and Cyclin T1 in response to hypoxia signalling alters the P-TEFb functional equilibrium, resulting in repression of transcription.


Figures

Figure 1.
Figure 1.
Formation of an inactive P-TEFb complex in response to hypoxia. (A) Association of endogenous Cdk9 with HEXIM1 and Cyclin T1 in cells treated with normoxia (N) and hypoxia (H) in the presence or absence of IL-1β for 1 h. Whole cell lysates were immunoprecipitated (IP) with a rabbit anti-Cdk9 antibody followed by western blotting with goat anti-Cyclin T1 and a sheep anti-HEXIM1 antibody. Western blot with a monoclonal anti-Cdk9 antibody served as a control of total immunoprecipitated protein. To disrupt 7SK snRNA in ribonucleoprotein complexes, one set of cell lysates was treated with RNase A for 2 h prior to immunoprecipitation. Columns represent mean of densitometric quantification of 6 western blots obtained from independent immunoprecipitations (n = 6); bars, SE; NT, without IL-1β treatment. *P < 0.05 as compared with normoxia; #P < 0.05 as compared with IL-1β-treated normoxic samples. (B) Association of cMyc/His-taged Cdk9 with HEXIM1 under normoxia (N) and hypoxia (H). Samples were immunoprecipitated using a monoclonal anti-cMyc antibody and analyzed as in (A). Western blot with a rabbit anti-Cdk9 antibody served as a control of total immunoprecipitated protein. Data shown represent one of two independent experiments. (C) Interactions of Cdk9-HEXIM1 and Cyclin T1-HEXIM1 were analyzed by P-LISA assay using rabbit anti-HEXIM1, mouse anti-Cdk9 and goat anti-Cyclin T1 antibodies. HeLa cells were exposured to hypoxia in the presence or absence of IL-1β for 1 h. PLA-signals of protein–protein interactions are shown as white speckles. Nuclei stained with SYTO 16 Nucleic Acid Stain in blue.
Figure 2.
Figure 2.
Effect of depletion of class I HDACs on 7SK snRNA and cellular distribution of N-CoR/HDAC3 and Cdk9 in normoxic and hypoxic HeLa cells. (A) Effect of disruption of class I HDACs on the formation of an inactive endogenous P-TEFb complex in response to hypoxia. HeLa cells were exposed for 1 h to a normoxic (N) or hypoxic (H) gas mixture 48 h after transfection with siRNA. Whole cell lysates were immunoprecipitated with a goat anti-Cyclin T1 antibody and analyzed by western blot using rabbit anti-HEXIM1 and an anti-Cdk9 antibody. Direct western blots of HDAC1, HDAC2 and HDAC3 served as a control for siRNA-mediated knockdown. Western blot with an anti-Cyclin T1 antibody served as a control of total immunoprecipitated protein. (B) Localization of endogenous Cdk9 (red) and HDAC3 (green). Cells were treated with hypoxia, IL-1β or their combination for 2 h and analyzed by immunofluorescence staining. (C) Immunofluorescence showing cellular localization of endogenous HDAC3 (green) and N-CoR (red) in response to 2 h exposure to IL-1β alone or in combination with hypoxia. Nucleic acids were stained using TO-PRO-3 (blue).
Figure 3.
Figure 3.
Hypoxic repression of Cdk9 and Cyclin T1 acetylation. (A) Intracellular distribution of Cdk9 acetylated at lysine residues in response to hypoxia. HeLa cells were pretreated with or without 500 nM TSA for 1 h and subsequently exposed to hypoxia for 1 h. Acetylated Cdk9 was analyzed by P-LISA assay using rabbit anti-AcLys and mouse anti-Cdk9 antibodies. (B) Acetylation of Cdk9 in response to 1 h exposure under normoxic (N) or hypoxic (H) gas mixtures with or without IL-1β. Immunoprecipitated Cdk9 was examined by western blotting with antibodies against acetyl-Lysin (AcLys) or Cdk9. All buffers used in this assay were supplemented with 100 ng/ml TSA to block endogenous HDAC activity. (C) Intracellular distribution of acetylated Cyclin T1 was analyzed by P-LISA assay using rabbit anti-AcLys and goat anti-Cyclin T1 antibodies. HeLa cells were pretreated with or without 500 nM TSA for 1 h followed by exposure to hypoxia for 1 h. Nucleic acids were stained using TOPRO-3 (blue).
Figure 4.
Figure 4.
The role of HDACs in hypoxic deacetylation of Cdk9 and Cyclin T1. HeLa cells were exposed for 1 h under normoxia or hypoxia 48 h after transfection with siRNA directed against HDAC1, HDAC2 or HDAC3. (A) Acetylated Cdk9 was analyzed by P-LISA assay using rabbit anti-AcLys and mouse anti-Cdk9 antibodies. (B) Acetylated Cyclin T1 was analyzed by P-LISA assay using rabbit anti-AcLys and goat anti-Cyclin T1 antibodies. P-LISA signals are shown in white and the nuclei in blue.
Figure 5.
Figure 5.
Hypoxia represses MCP-1 mRNA synthesis by inhibiting IL-1β-induced Ser2 phosphorylation of Pol II CTD. (A) Effect of hypoxia on MCP-1 and IL-8 mRNAs expressions. HeLa cells were exposed to normoxia or hypoxia without (NT) or with IL-1β for 1 h. mRNA levels were quantitated by Q-PCR in triplicate and normalized by 18S rRNA levels. Data are expressed as a percentage of expression under normoxia. *P < 0.05; **P < 0.01, as compared with normoxia; #P < 0.05; ##P < 0.01, as compared with IL-1β-treated normoxic samples. (B) Pol II Rbp1 promoter occupancy of the IL-8 and MCP-1 genes analyzed by ChIP assay after treatment with IL-1β and/or hypoxia for the indicated periods of time. (C) The phosphorylation status of Ser5 and Ser2 residues of Pol II CTD set on the MCP-1 and IL-8 gene promoters in the cells treated with IL-1β under normoxia or hypoxia for the indicated time periods. (B-C) Immunoprecipitated DNA was quantified by Q-PCR in triplicate and after normalization by 10% input expressed as a percentage of binding at a 0 min time point. *P < 0.05; **P < 0.01, as compared with binding at 0 min. (D) ChIP assay analysis of P-TEFb enrichment on the MCP-1 and IL-8 promoters. HeLa cells were treated with IL-1β and/or hypoxia for the indicated periods of time. DNA was immunoprecipitated using Cdk9 and Cyclin T1 antibodies and quantified by Q-PCR Data expressed as a percentage of binding in normoxic cells at 30 min or 60 min time point after normalization by 10% input. **P <0.01 as compared with normoxia; ##P < 0.01, as compared with IL-1β-treated normoxic samples.
Figure 6.
Figure 6.
HEXIM1 is required for hypoxia-mediated MCP-1 gene repression. (A) Effect of Fcp-1 and HEXIM1 depletion by siRNA on the responsiveness of MCP-1 and IL-8 mRNAs expressions to hypoxia. Forty-eight hours after transfection with siRNA, cells were treated with IL-1β in combination with normoxia or hypoxia for 6 h. Total RNA was isolated and analyzed by RT-qPCR. Data were normalized by 18S rRNA expressions and presented as a percentage of expression of normoxic samples transfected with scrambled control siRNA. Data are representative of two independent experiments. (B) HMBA treatment mimicked the effect of hypoxia on MCP-1 mRNA expression. HeLa cells were treated with IL-1β alone or in combination with hypoxia or the indicated concentrations of HMBA for 6 h. The levels of MCP-1 mRNA were normalized by 18S rRNA. The expression level in normoxic cells was set as 100%. **P < 0.01, as compared with normoxia.
Figure 7.
Figure 7.
Role of nuclear receptor co-repressors in hypoxic repression of MCP-1 expression. (A) Cells were transfected with 200 pmol of N-CoR or SMRT siRNA 48 h prior to the treatment with IL-1β under normoxia or hypoxia for 6 h. MCP-1 and IL-8 mRNAs were measured by Q-PCR in triplicate. Expression in the cells transfected with control siRNA and treated with IL-1β under normoxia was set as 100%. *P < 0.05; **P < 0.01, as compared with normoxia + IL-1, siScr; #P < 0.05; ##P < 0.01, as compared with normoxia + IL-1, siN-CoR or siSMRT. (B) Relative N-CoR and SMRT binding to the indicated regions of MCP-1 and IL-8 promoters in cells treated with IL-1β and hypoxia for the indicated periods. Immunoprecipitated DNA was quantified by Q-PCR and after normalization by 10% input expressed as a percentage of binding at a 0 min time point. *P < 0.05; **P < 0.01, as compared with binding at 0 min.
Figure 8.
Figure 8.
Microarray analysis of primary responses to hypoxia and identification of HEXIM1-dependent genes. HeLa cells were transfected with control (siScr) and HEXIM1-targeted (siHEXIM) double-strand siRNA and 48 h after treated with IL-1β in combination with normoxia (N+IL) or hypoxia (H+IL) for 1 h. (A) Venn diagram of genes down-regulated by hypoxia and their dependence on HEXIM1. (B) Venn diagram of genes up-regulated by hypoxia and their dependence on HEXIM1. (C) Microarray identification of HEXIM1-dependent genes among the probes with decreased expression in hypoxia. (D) Microarray identification of HEXIM1-dependent genes among the probes with increased expression in hypoxia. (E) The model of hypoxic inhibition of P-TEFb. Hypoxia enhances formation of an inactive P-TEFb complex with its endogenous inhibitors Hexim1 and 7SK snRNA. This process requires the HDAC3/N-CoR repressor complex. Inhibition of P-TEFb is mediated by HDAC-dependent deacetylation of P-TEFb subunits Cdk9 and Cyclin T1. HDAC2 is required for active P-TEFb via an unknown mechanism.

Similar articles

Cited by

References

    1. Mohyeldin A., Garzon-Muvdi T., Quinones-Hinojosa A. Oxygen in stem cell biology: a critical component of the stem cell niche. Cell Stem Cell. 2010;7:150–161. - PubMed
    1. Safronova O., Morita I. Transcriptome remodeling in hypoxic inflammation. J. Dent. Res. 2010;89:430–444. - PubMed
    1. Safronova O., Pluemsampant S., Nakahama K., Morita I. Regulation of chemokine gene expression by hypoxia via cooperative activation of NF-kappaB and histone deacetylase. Int. J. Biochem. Cell Biol. 2009;41:2270–2280. - PubMed
    1. Aoi Y., Nakahama K., Morita I., Safronova O. The involvement of DNA and histone methylation in the repression of IL-1beta-induced MCP-1 production by hypoxia. Biochem. Biophys. Res. Commun. 2011;414:252–258. - PubMed
    1. Safronova O., Nakahama K., Onodera M., Muneta T., Morita I. Effect of hypoxia on monocyte chemotactic protein-1 (MCP-1) gene expression induced by Interleukin-1beta in human synovial fibroblasts. Inflamm. Res. 2003;52:480–486. - PubMed

Publication types

MeSH terms