. 2014 Aug;42(14):8939-53.
doi: 10.1093/nar/gku609. Epub 2014 Jul 22.

dREAM co-operates with insulator-binding proteins and regulates expression at divergently paired genes

Affiliations

dREAM co-operates with insulator-binding proteins and regulates expression at divergently paired genes

Michael Korenjak et al. Nucleic Acids Res. 2014 Aug.

Abstract

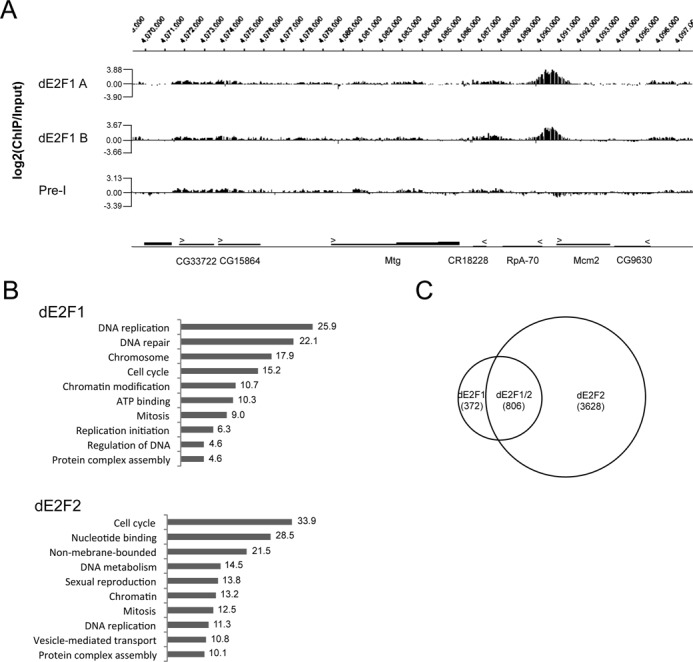
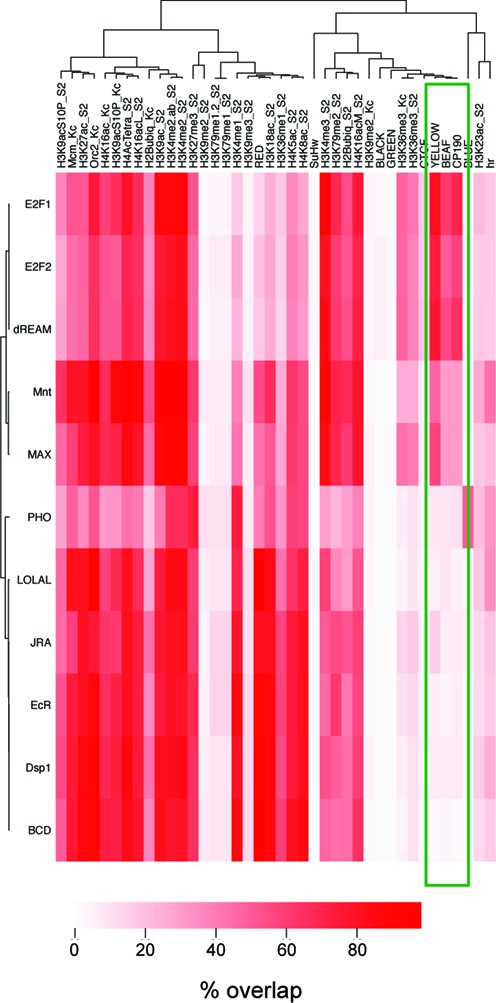
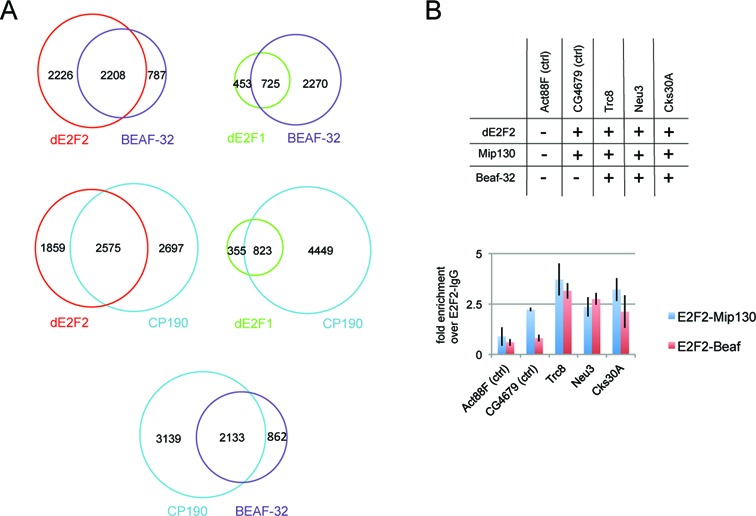
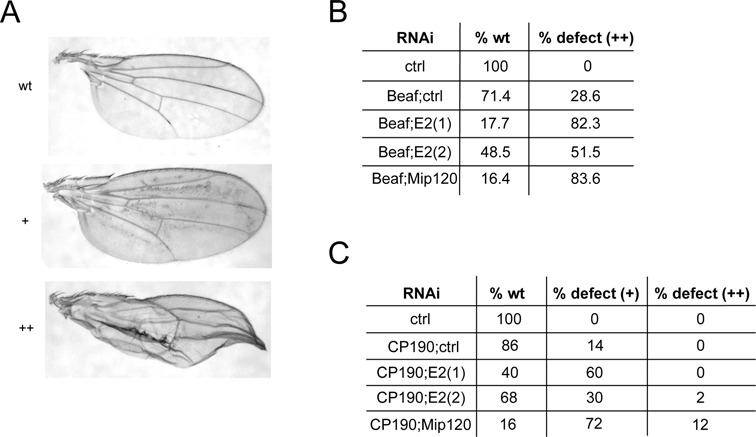
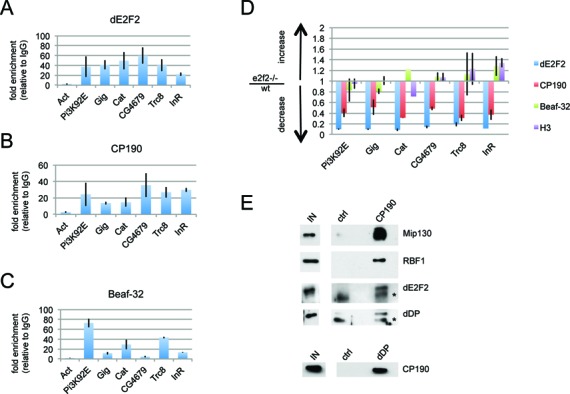
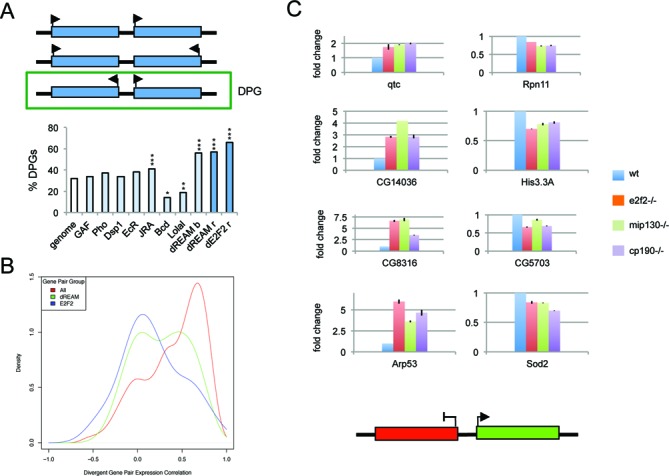
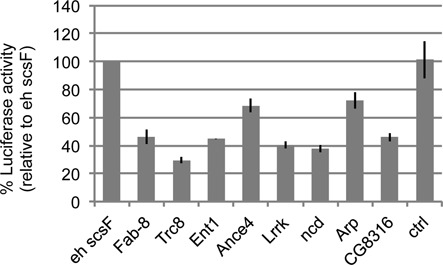
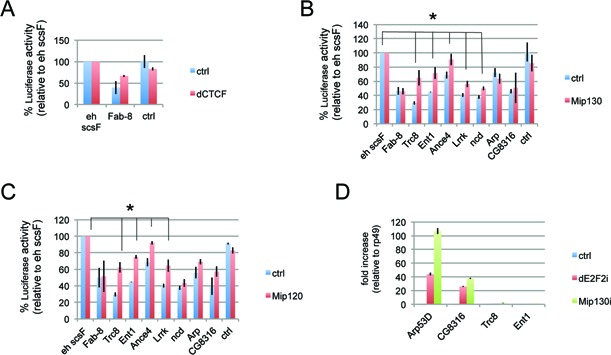
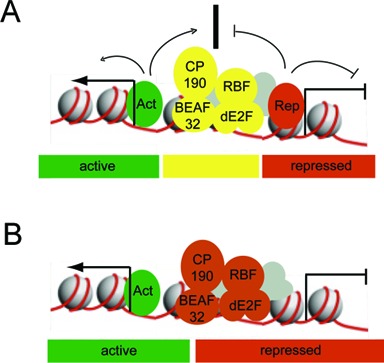
dREAM complexes represent the predominant form of E2F/RBF repressor complexes in Drosophila. dREAM associates with thousands of sites in the fly genome but its mechanism of action is unknown. To understand the genomic context in which dREAM acts we examined the distribution and localization of Drosophila E2F and dREAM proteins. Here we report a striking and unexpected overlap between dE2F2/dREAM sites and binding sites for the insulator-binding proteins CP190 and Beaf-32. Genetic assays show that these components functionally co-operate and chromatin immunoprecipitation experiments on mutant animals demonstrate that dE2F2 is important for association of CP190 with chromatin. dE2F2/dREAM binding sites are enriched at divergently transcribed genes, and the majority of genes upregulated by dE2F2 depletion represent the repressed half of a differentially expressed, divergently transcribed pair of genes. Analysis of mutant animals confirms that dREAM and CP190 are similarly required for transcriptional integrity at these gene pairs and suggest that dREAM functions in concert with CP190 to establish boundaries between repressed/activated genes. Consistent with the idea that dREAM co-operates with insulator-binding proteins, genomic regions bound by dREAM possess enhancer-blocking activity that depends on multiple dREAM components. These findings suggest that dREAM functions in the organization of transcriptional domains.


Figures

Figure 1.
Figure 1.
dE2F1 and dE2F2 associate with thousands of sites in Drosophila tissue culture cells. (A) dE2F1 binds specifically to the Mcm2 promoter. Specific dE2F1 binding is represented by prominent peaks at the TSS of the Mcm2 gene. Genes are depicted as black bars and the direction of transcription is indicated by arrows. dE2F1a and dE2F1b represent two independent antibodies against dE2F1. Pre-I, preimmune serum. (B) dE2F1 and dE2F2 bound genes are highly enriched in cell cycle genes. Bound genes were annotated using the DAVID database (http://david.abcc.ncifcrf.gov/). Values indicate enrichment scores. (C) dE2F1 and dE2F2 binding sites overlap extensively. dE2F1/2, overlapping binding sites. Numbers in brackets indicate the number of binding sites.
Figure 2.
Figure 2.
Overlap of dE2F binding sites with general chromatin features. Coordinates of the peak centers of dE2F and control transcription factor sites were analyzed with respect to their overlap with chromatin feature coordinates extracted from previous studies (see Materials and Methods). The observed overlaps were plotted against each other using hierarchical clustering. Red intensity indicates the frequency of overlap. Extensive overlap with YELLOW chromatin, CP190 and Beaf-32 is highlighted with a green box. Lolal, Lola-like; Jra, Jun-related antigen; EcR, Ecdysone Receptor; Bcd, Bicoid.
Figure 3.
Figure 3.
dE2F binding sites overlap extensively with insulator proteins CP190 and Beaf-32. (A) Binding site overlap of dE2F proteins with CP190 and Beaf-32. Numbers represent unique or overlapping binding sites, respectively. (B) dE2F2 and Beaf-32 simultaneously associate with common binding sites. Top panel shows binding of the indicated proteins at a set of five genes based on genomic association data. +, binding; -, no binding. ChIP Re-ChIP experiments were performed using chromatin from Drosophila third instar larvae. First IP: dE2F2; second IP: IgG, Mip130 or Beaf-32. Fold enrichment of dE2F2-Mip130 and dE2F2-Beaf-32 over dE2F2-IgG is shown for the indicated sites.
Figure 4.
Figure 4.
CP190 and Beaf-32 genetically interact with dREAM subunits. (A) Co-depletion of dREAM subunits and CP190 or Beaf-32 during wing development. RNAi lines were crossed to UAS-Dcr;Nub-Gal4 for expression in the larval wing disc and phenotypes were scored based on the severity of the wing defect. wt, wildtype; +, mild defects (extra vein tissue); ++, severe defects (blistering, wing structure changes). dREAM components genetically interact with Beaf-32 (B) and CP190 (C). Numbers represent the percentage of flies with the observed phenotype. Crosses were repeated three times and a representative outcome is shown in the table. ctrl, Luciferase RNAi line. E2(1) and E2(2) represent independent RNAi lines targeting dE2F2 with different efficiency [E2(1) > E2(2)].
Figure 5.
Figure 5.
dE2F2 is required for efficient chromatin binding of CP190. ChIP-qPCR in Drosophila third instar larvae using antibodies against Beaf-32 (A), CP190 (B) and dE2F2 (C) for a set of randomly chosen sites confirmed co-occupancy of the proteins in vivo. Fold enrichment relative to IgG is shown. The average of three independent experiments is shown. (D) Reduced CP190 chromatin binding in e2f2 mutant animals. Bargraphs show the change in chromatin binding of the indicated proteins in e2f2 mutant relative to wildtype animals. dE2F2 (blue), CP190 (red), Beaf-32 (green), H3 (purple). The average of three independent experiments is shown. (E) dREAM and CP190 physically interact. Immunoprecipitation using antibodies against CP190 (top panel) or dDP (bottom panel) from S2 cells. Co-immunoprecipitation was confirmed by western blotting for the indicated proteins. ctrl, IgG. IN, input. 0.5% input is shown on the left. *, unspecific cross-reacting band.
Figure 6.
Figure 6.
dREAM and CP190 are important for transcriptional integrity at differentially expressed, DPGs. (A) dREAM is enriched at DPGs. The diagram in the upper panel depicts the possible orientation of neighboring genes. Green box highlights DPGs. Lower panel shows the percentage of DPGs among genes bound by the indicated transcription factors, including dREAM (light blue bars), compared to the entire genome (white bar). The dark blue bars represent the percentage of DPGs among dREAM- and dE2F2-regulated genes, respectively (14,6). b, bound; r, repressed. *P < 0.05, **P < 0.01, ***P < 0.0001 (Chi-Square Test). (B) dREAM-repressed DPGs are not co-regulated. The distributions of expression correlation for the two genes in all divergent gene pairs (red), dE2F2- (blue) and dREAM-repressed DPGs (green) were plotted. (C) Differentially expressed DPGs are de-regulated in dREAM and cp190 mutants. qRT-PCR with primers for the indicated genes was carried out using RNA isolated from wildtype, e2f2, mip130 and cp190 mutant third instar larvae. Fold change of gene expression in mutant compared to wildtype animals is shown. Stably repressed genes are shown on the left, their highly expressed divergent pairs are displayed on the right. Experiments were performed in triplicate.
Figure 7.
Figure 7.
Regions bound by dREAM and CP190/Beaf-32 possess enhancer-blocking activity. A construct harboring the Luciferase reporter gene under the control of the Hsp70 promoter regulated by an upstream enhancer element (eh scsF) was transfected into S2 cells and used to assess baseline Luciferase activity. Controls: Fab-8, positive control; ctrl, negative control and dREAM, CP190/Beaf-32 bound fragments were inserted between enhancer and promoter. Luciferase activity is shown relative to baseline (eh scsF) activity. Enhancer-blocking assays were performed in triplicate.
Figure 8.
Figure 8.
dREAM subunits Mip130 and Mip120 are important for enhancer-blocking activity of bound regions. (A) dCTCF is required for efficient Fab-8 enhancer blocking. Enhancer-blocking activity of Fab-8 and a control element was measured upon control or dCTCF RNAi knockdown. (B,C) Enhancer-blocking activity of control (Fab-8, positive control; ctrl, negative control), and dREAM, CP190/Beaf-32 bound regions was measured following control and Mip130 (B) or Mip120 (C) RNAi. Luciferase activity is shown relative to baseline activity. Enhancer-blocking assays were performed in triplicate. Asterisk indicates statistically significant reduction in enhancer blocking between control and specific RNAi treatments (P < 0.05, unpaired t Test). (D) Transcriptional effect of dREAM knockdown on endogenous genes located near enhancer-blocking fragments. RNA was isolated from RNAi-treated cells from the enhancer-blocking assay. Expression levels of the indicated genes were measured by qRT-PCR. Fold change in gene expression of specific RNAi relative to control RNAi is shown. Experiments were performed in triplicate.
Figure 9.
Figure 9.
Model depicting potential roles for dREAM and insulator-binding proteins at DPGs. (A) dREAM/CP190-Beaf-32 as a boundary factor. dREAM, CP190 and Beaf-32 establish a boundary between independently regulated chromatin domains. Yellow, boundary element; green, active domain; red, inactive domain. Act, Activator; Rep, Repressor. (B) dREAM/CP190-Beaf-32 as a stable transcriptional repressor. Loss of the repressor (dREAM/CP190-Beaf-32) can result in spreading of the adjacent activator (Act) or vacate the binding site of a gene-specific activator.

Similar articles

Cited by

References

    1. Cooper K. Rb, whi it's not just for metazoans anymore. Oncogene. 2006;25:5228–5232. - PubMed
    1. Gutzat R., Borghi L., Gruissem W. Emerging roles of RETINOBLASTOMA-RELATED proteins in evolution and plant development. Trends Plant Sci. 2012;17:139–148. - PubMed
    1. van den Heuvel S., Dyson N.J. Conserved functions of the pRB and E2F families. Nat. Rev. Mol. Cell Biol. 2008;9:713–724. - PubMed
    1. Du W., Dyson N. The role of RBF in the introduction of G1 regulation during Drosophila embryogenesis. EMBO J. 1999;18:916–925. - PMC - PubMed
    1. Datar S.A., Jacobs H.W., de la Cruz A.F., Lehner C.F., Edgar B.A. The Drosophila cyclin D-Cdk4 complex promotes cellular growth. EMBO J. 2000;19:4543–4554. - PMC - PubMed

Publication types

MeSH terms

LinkOut - more resources