

The comprehensive transcriptional analysis in Caenorhabditis elegans by integrating ChIP-seq and gene expression data
- PMID: 25023089
- PMCID: PMC7045094
- DOI: 10.1017/S0016672314000081
The comprehensive transcriptional analysis in Caenorhabditis elegans by integrating ChIP-seq and gene expression data
Abstract
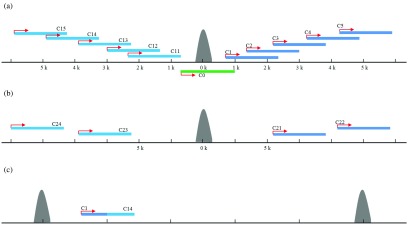
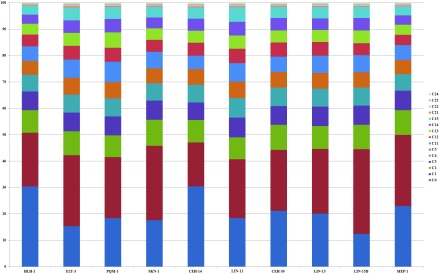
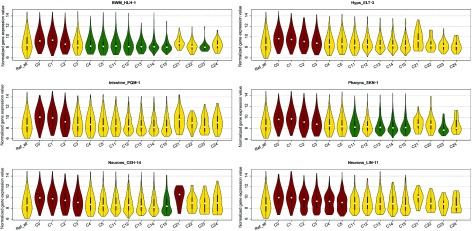
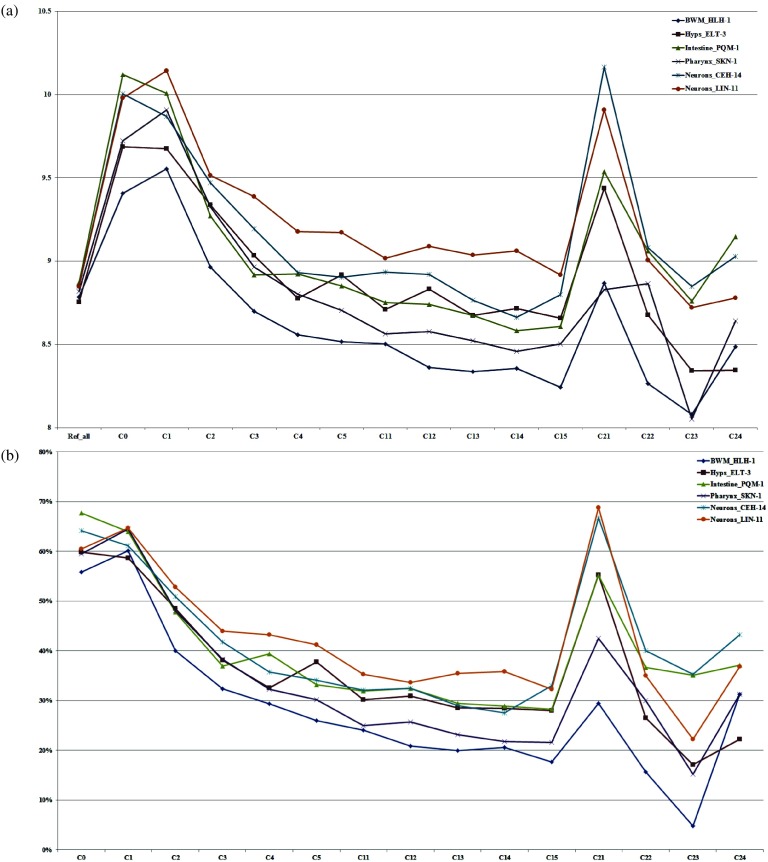
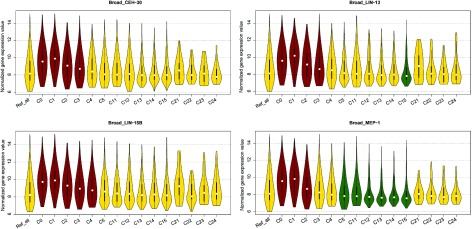
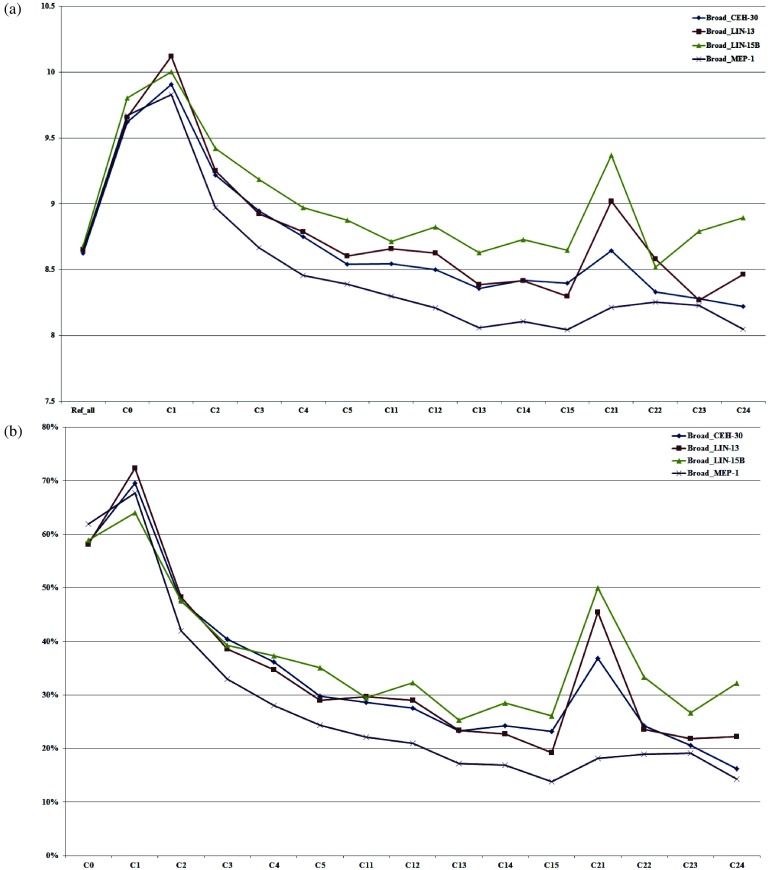
The fundamental step of learning transcriptional regulation mechanism is to identify the target genes regulated by transcription factors (TFs). Despite numerous target genes identified by chromatin immunoprecipitation followed by high-throughput sequencing technology (ChIP-seq) assays, it is not possible to infer function from binding alone in vivo. This is equally true in one of the best model systems, the nematode Caenorhabditis elegans (C. elegans), where regulation often occurs through diverse TF binding features of transcriptional networks identified in modENCODE. Here, we integrated ten ChIP-seq datasets with genome-wide expression data derived from tiling arrays, involved in six TFs (HLH-1, ELT-3, PQM-1, SKN-1, CEH-14 and LIN-11) with tissue-specific and four TFs (CEH-30, LIN-13, LIN-15B and MEP-1) with broad expression patterns. In common, TF bindings within 3 kb upstream of or within its target gene for these ten studies showed significantly elevated level of expression as opposed to that of non-target controls, indicated that these sites may be more likely to be functional through up-regulating its target genes. Intriguingly, expression of the target genes out of 5 kb upstream of their transcription start site also showed high levels, which was consistent with the results of following network component analysis. Our study has identified similar transcriptional regulation mechanisms of tissue-specific or broad expression TFs in C. elegans using ChIP-seq and gene expression data. It may also provide a novel insight into the mechanism of transcriptional regulation not only for simple organisms but also for more complex species.
Figures

Similar articles
-
Diverse transcription factor binding features revealed by genome-wide ChIP-seq in C. elegans.Genome Res. 2011 Feb;21(2):245-54. doi: 10.1101/gr.114587.110. Epub 2010 Dec 22. Genome Res. 2011. PMID: 21177963 Free PMC article.
-
Integrative analysis of C. elegans modENCODE ChIP-seq data sets to infer gene regulatory interactions.Genome Res. 2013 Jun;23(6):941-53. doi: 10.1101/gr.152876.112. Epub 2013 Mar 26. Genome Res. 2013. PMID: 23531767 Free PMC article.
-
Chromatin immunoprecipitation and multiplex sequencing (ChIP-Seq) to identify global transcription factor binding sites in the nematode Caenorhabditis elegans.Methods Enzymol. 2014;539:89-111. doi: 10.1016/B978-0-12-420120-0.00007-4. Methods Enzymol. 2014. PMID: 24581441
-
Role of ChIP-seq in the discovery of transcription factor binding sites, differential gene regulation mechanism, epigenetic marks and beyond.Cell Cycle. 2014;13(18):2847-52. doi: 10.4161/15384101.2014.949201. Cell Cycle. 2014. PMID: 25486472 Free PMC article. Review.
-
ChIP-Seq Data Analysis to Define Transcriptional Regulatory Networks.Adv Biochem Eng Biotechnol. 2017;160:1-14. doi: 10.1007/10_2016_43. Adv Biochem Eng Biotechnol. 2017. PMID: 28070596 Review.
Cited by
-
Comparative proteome analysis between C . briggsae embryos and larvae reveals a role of chromatin modification proteins in embryonic cell division.Sci Rep. 2017 Jun 27;7(1):4296. doi: 10.1038/s41598-017-04533-8. Sci Rep. 2017. PMID: 28655887 Free PMC article.
References
-
- Arnosti D. N. & Kulkarni M. M. (2005). Transcriptional enhancers: intelligent enhanceosomes or flexible billboards? Journal of Cellular Biochemistry 94, 890–898. - PubMed
-
- Boyer L. A., Lee T. I., Cole M. F., Johnstone S. E., Levine S. S., Zucker J. P., Guenther M. G., Kumar R. M., Murray H. L., Jenner R. G., Gifford D. K., Melton D. A., Jaenisch R. & Young R. A. (2005). Core transcriptional regulatory circuitry in human embryonic stem cells. Cell 122, 947–56. - PMC - PubMed
-
- Chen X., Xu H., Yuan P., Fang F., Huss M., Vega V. B., Wong E., Orlov Y. L., Zhang W., Jiang J., Loh Y. H., Yeo H. C., Yeo Z. X., Narang V., Govindarajan K. R., Leong B., Shahab A., Ruan Y., Bourque G., Sung W. K., Clarke N. D., Wei C. L. & Ng H. H. (2008). Integration of external signaling pathways with the core transcriptional network in embryonic stem cells. Cell 133, 1106–17. - PubMed
Publication types
MeSH terms
Substances
LinkOut - more resources
Full Text Sources
Other Literature Sources
Miscellaneous