

Evidence of contribution of iPLA2β-mediated events during islet β-cell apoptosis due to proinflammatory cytokines suggests a role for iPLA2β in T1D development
- PMID: 25004092
- PMCID: PMC4138580
- DOI: 10.1210/en.2013-2134
Evidence of contribution of iPLA2β-mediated events during islet β-cell apoptosis due to proinflammatory cytokines suggests a role for iPLA2β in T1D development
Abstract
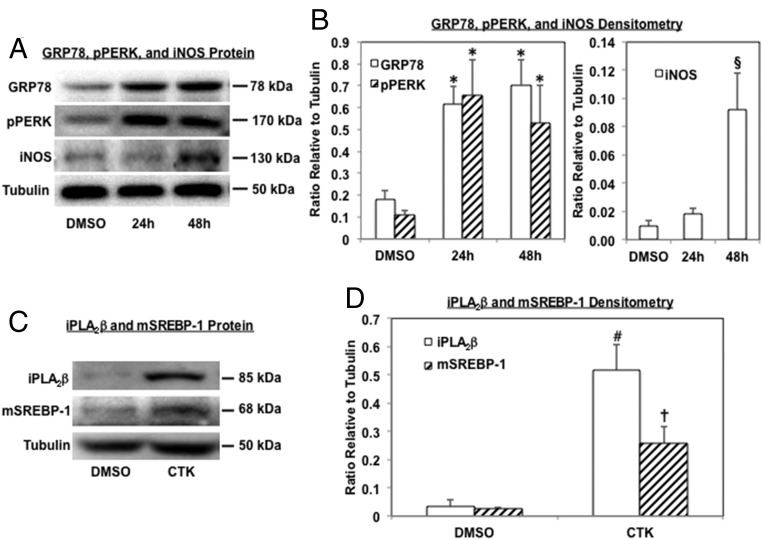
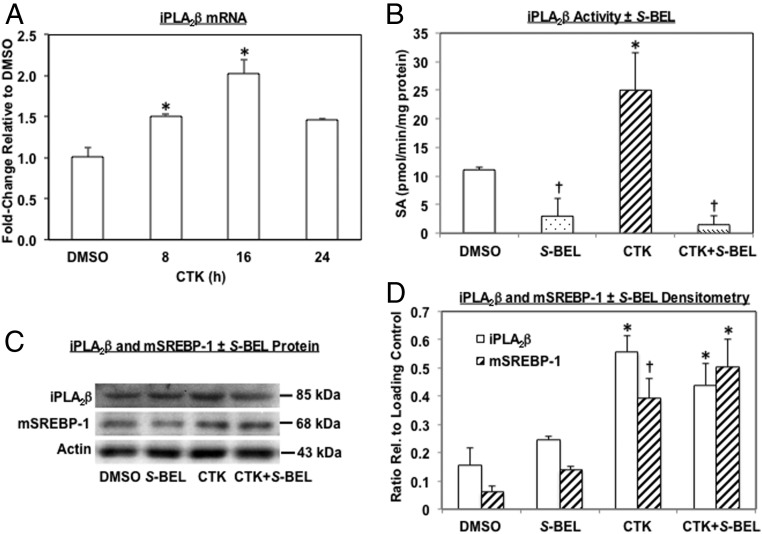
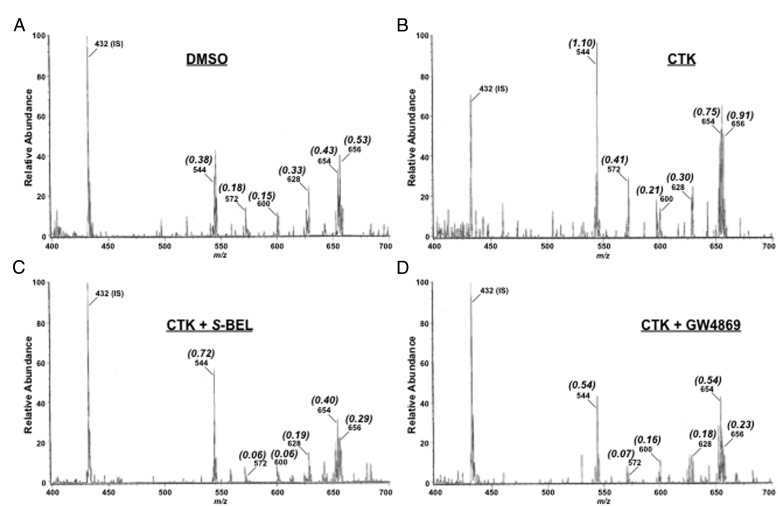
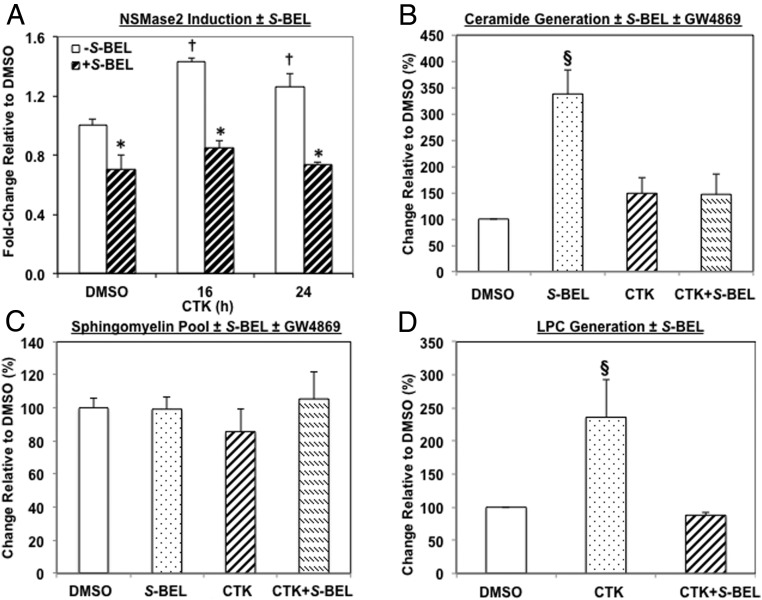
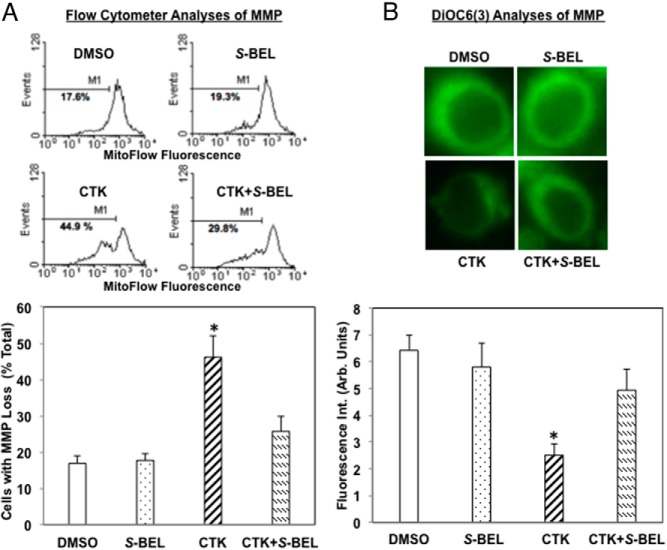
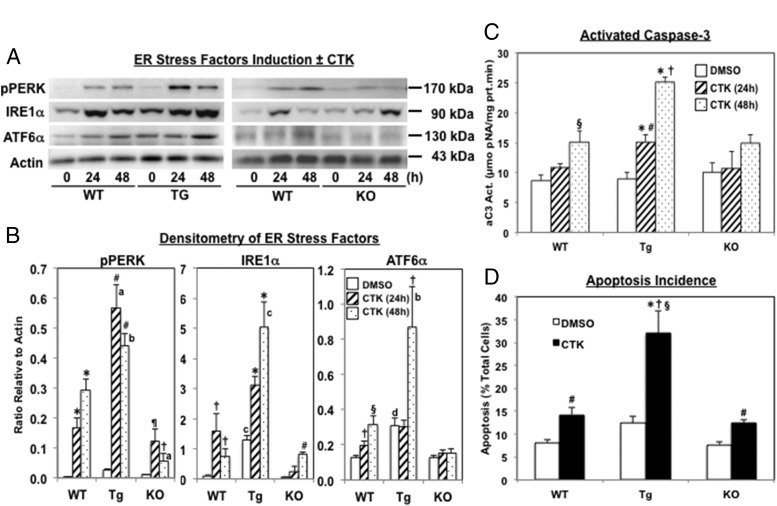
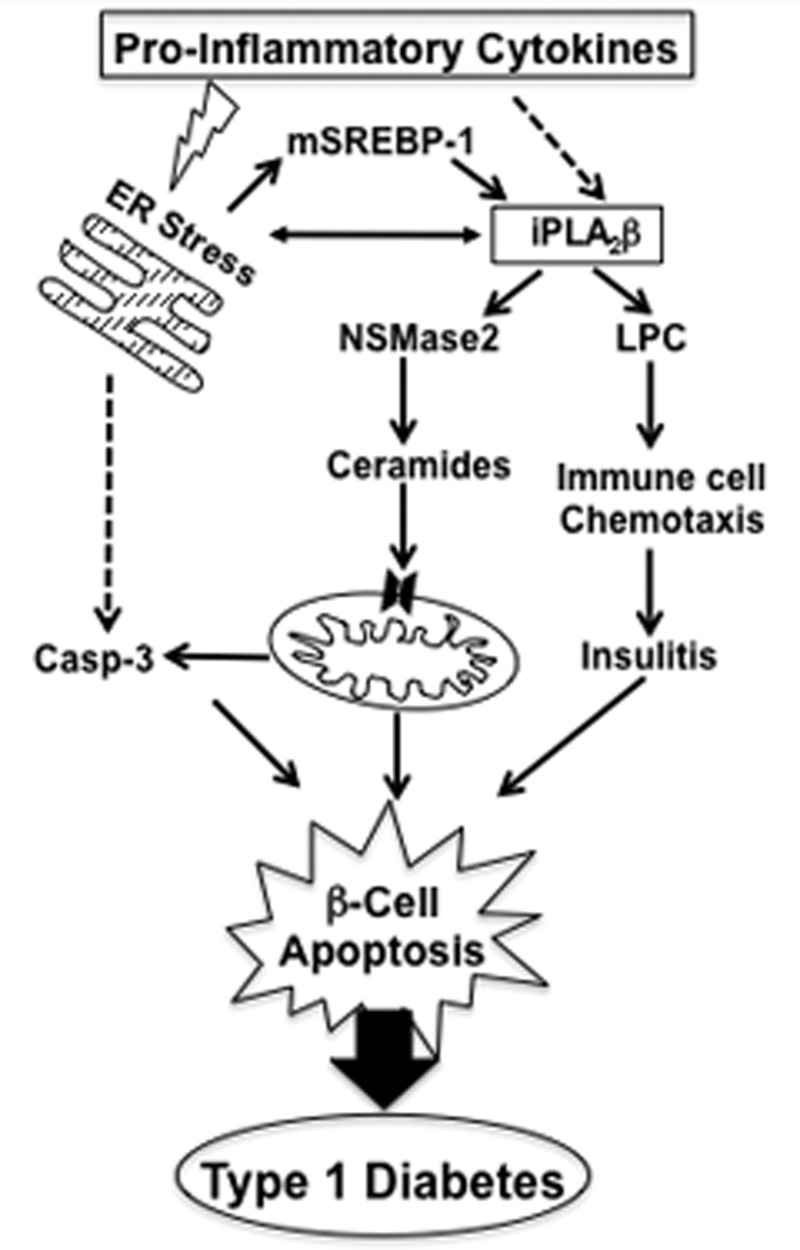
Type 1 diabetes (T1D) results from autoimmune destruction of islet β-cells, but the underlying mechanisms that contribute to this process are incompletely understood, especially the role of lipid signals generated by β-cells. Proinflammatory cytokines induce ER stress in β-cells and we previously found that the Ca(2+)-independent phospholipase A2β (iPLA2β) participates in ER stress-induced β-cell apoptosis. In view of reports of elevated iPLA2β in T1D, we examined if iPLA2β participates in cytokine-mediated islet β-cell apoptosis. We find that the proinflammatory cytokine combination IL-1β+IFNγ, induces: a) ER stress, mSREBP-1, and iPLA2β, b) lysophosphatidylcholine (LPC) generation, c) neutral sphingomyelinase-2 (NSMase2), d) ceramide accumulation, e) mitochondrial membrane decompensation, f) caspase-3 activation, and g) β-cell apoptosis. The presence of a sterol regulatory element in the iPLA2β gene raises the possibility that activation of SREBP-1 after proinflammatory cytokine exposure contributes to iPLA2β induction. The IL-1β+IFNγ-induced outcomes (b-g) are all inhibited by iPLA2β inactivation, suggesting that iPLA2β-derived lipid signals contribute to consequential islet β-cell death. Consistent with this possibility, ER stress and β-cell apoptosis induced by proinflammatory cytokines are exacerbated in islets from RIP-iPLA2β-Tg mice and blunted in islets from iPLA2β-KO mice. These observations suggest that iPLA2β-mediated events participate in amplifying β-cell apoptosis due to proinflammatory cytokines and also that iPLA2β activation may have a reciprocal impact on ER stress development. They raise the possibility that iPLA2β inhibition, leading to ameliorations in ER stress, apoptosis, and immune responses resulting from LPC-stimulated immune cell chemotaxis, may be beneficial in preserving β-cell mass and delaying/preventing T1D evolution.
Figures

Similar articles
-
Group VIA Phospholipase A2 (iPLA2β) Modulates Bcl-x 5'-Splice Site Selection and Suppresses Anti-apoptotic Bcl-x(L) in β-Cells.J Biol Chem. 2015 Apr 24;290(17):11021-31. doi: 10.1074/jbc.M115.648956. Epub 2015 Mar 11. J Biol Chem. 2015. PMID: 25762722 Free PMC article.
-
Genetic modulation of islet β-cell iPLA₂β expression provides evidence for its impact on β-cell apoptosis and autophagy.Islets. 2013 Jan-Feb;5(1):29-44. doi: 10.4161/isl.23758. Epub 2013 Jan 1. Islets. 2013. PMID: 23411472 Free PMC article.
-
Alterations in β-Cell Sphingolipid Profile Associated with ER Stress and iPLA2β: Another Contributor to β-Cell Apoptosis in Type 1 Diabetes.Molecules. 2021 Oct 21;26(21):6361. doi: 10.3390/molecules26216361. Molecules. 2021. PMID: 34770770 Free PMC article.
-
A link between endoplasmic reticulum stress-induced β-cell apoptosis and the group VIA Ca2+-independent phospholipase A2 (iPLA2β).Diabetes Obes Metab. 2010 Oct;12 Suppl 2(0 2):93-8. doi: 10.1111/j.1463-1326.2010.01270.x. Diabetes Obes Metab. 2010. PMID: 21029305 Free PMC article. Review.
-
The expression and function of a group VIA calcium-independent phospholipase A2 (iPLA2beta) in beta-cells.Can J Physiol Pharmacol. 2004 Oct;82(10):824-32. doi: 10.1139/y04-064. Can J Physiol Pharmacol. 2004. PMID: 15573142 Review.
Cited by
-
Macrophage polarization is linked to Ca2+-independent phospholipase A2β-derived lipids and cross-cell signaling in mice.J Lipid Res. 2020 Feb;61(2):143-158. doi: 10.1194/jlr.RA119000281. Epub 2019 Dec 9. J Lipid Res. 2020. PMID: 31818877 Free PMC article.
-
iPLA2β Contributes to ER Stress-Induced Apoptosis during Myocardial Ischemia/Reperfusion Injury.Cells. 2021 Jun 9;10(6):1446. doi: 10.3390/cells10061446. Cells. 2021. PMID: 34207793 Free PMC article.
-
Differential lipid signaling from CD4+ and CD8+ T cells contributes to type 1 diabetes development.Front Immunol. 2024 Sep 18;15:1444639. doi: 10.3389/fimmu.2024.1444639. eCollection 2024. Front Immunol. 2024. PMID: 39359722 Free PMC article.
-
Group VIA Phospholipase A2 (iPLA2β) Modulates Bcl-x 5'-Splice Site Selection and Suppresses Anti-apoptotic Bcl-x(L) in β-Cells.J Biol Chem. 2015 Apr 24;290(17):11021-31. doi: 10.1074/jbc.M115.648956. Epub 2015 Mar 11. J Biol Chem. 2015. PMID: 25762722 Free PMC article.
-
Neutral sphingomyelinase-2 and cardiometabolic diseases.Obes Rev. 2021 Aug;22(8):e13248. doi: 10.1111/obr.13248. Epub 2021 Mar 18. Obes Rev. 2021. PMID: 33738905 Free PMC article. Review.
References
-
- Tisch R, McDevitt H. Insulin-dependent diabetes mellitus. Cell. 1996;85:291–297 - PubMed
-
- Rabinovitch A, Suarez-Pinzon WL. Cytokines and their roles in pancreatic islet beta-cell destruction and insulin-dependent diabetes mellitus. Biochem Pharmacol. 1998;55:1139–1149 - PubMed
-
- Mandrup-Poulsen T. Beta-cell apoptosis: stimuli and signaling. Diabetes. 2001;50:S58–S63 - PubMed
-
- Harding HP, Zeng H, Zhang Y, et al. Diabetes mellitus and exocrine pancreatic dysfunction in PERK−/− mice reveals a role for translational control in secretory cell survival. Mol Cell. 2001;7:1153–1163 - PubMed
-
- Oyadomari S, Araki E, Mori M. Endoplasmic reticulum stress-mediated apoptosis in pancreatic beta-cells. Apoptosis. 2002;7:335–345 - PubMed
Publication types
MeSH terms
Substances
Grants and funding
- R37 DK034388/DK/NIDDK NIH HHS/United States
- P60-DK20579/DK/NIDDK NIH HHS/United States
- R01 DK069455/DK/NIDDK NIH HHS/United States
- R01-DK69455/DK/NIDDK NIH HHS/United States
- DK34388/DK/NIDDK NIH HHS/United States
- P60 DK020579/DK/NIDDK NIH HHS/United States
- P30 DK020579/DK/NIDDK NIH HHS/United States
- P01-HL57278/HL/NHLBI NIH HHS/United States
- P30 DK079626/DK/NIDDK NIH HHS/United States
- P30 DK056341/DK/NIDDK NIH HHS/United States
- P60-DK079626/DK/NIDDK NIH HHS/United States
- P60 DK079626/DK/NIDDK NIH HHS/United States
- P01 HL057278/HL/NHLBI NIH HHS/United States
- P41 RR000954/RR/NCRR NIH HHS/United States
- P41-RR00954/RR/NCRR NIH HHS/United States
- P30-DK56341/DK/NIDDK NIH HHS/United States
LinkOut - more resources
Full Text Sources
Other Literature Sources
Medical
Molecular Biology Databases
Research Materials
Miscellaneous
