. 2014 Aug 15;193(4):1567-77.
doi: 10.4049/jimmunol.1400667. Epub 2014 Jul 7.

Clonotypic composition of the CD4+ T cell response to a vectored retroviral antigen is determined by its speed

Affiliations

Clonotypic composition of the CD4+ T cell response to a vectored retroviral antigen is determined by its speed

Georgina Thorborn et al. J Immunol. .

Abstract

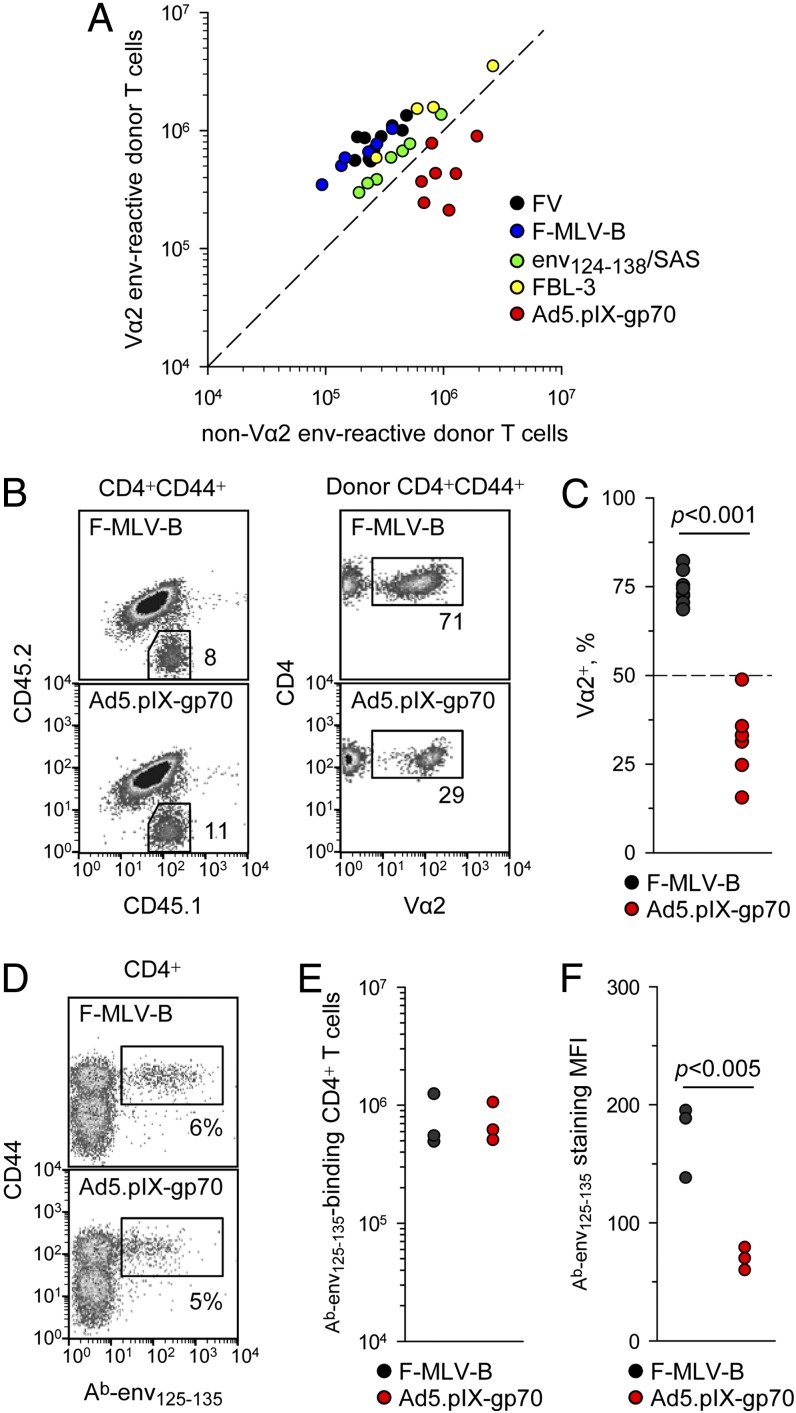
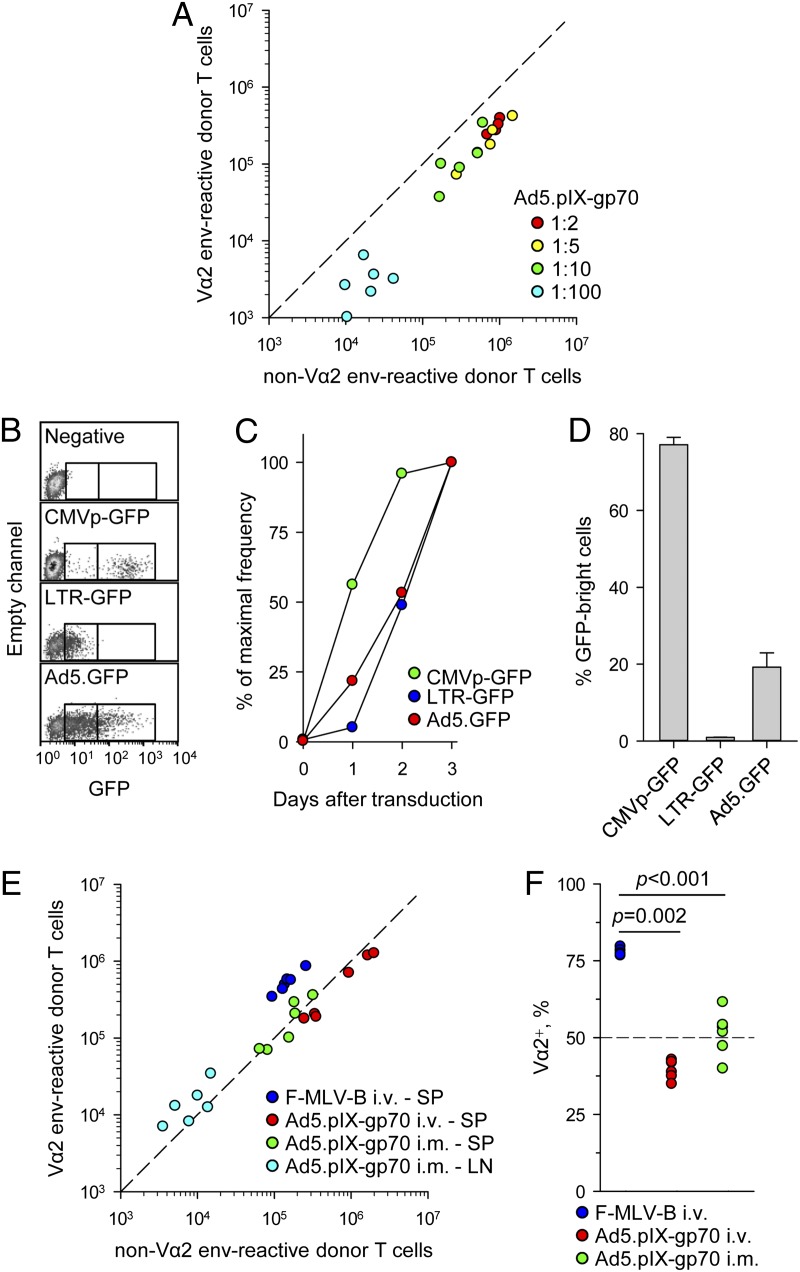
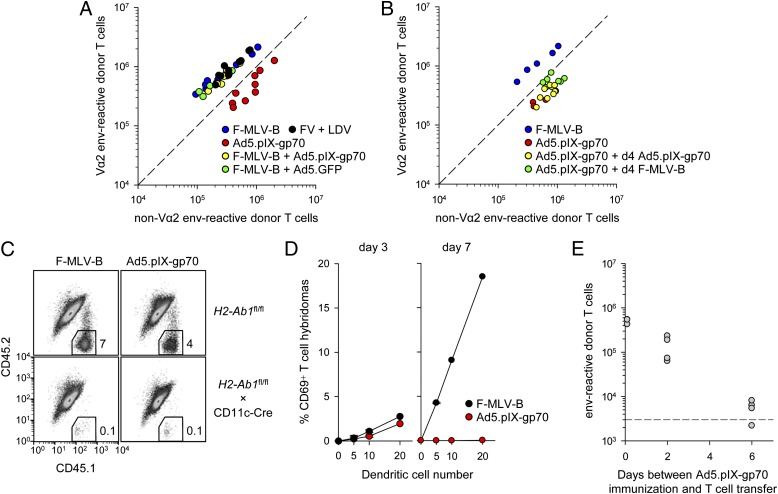
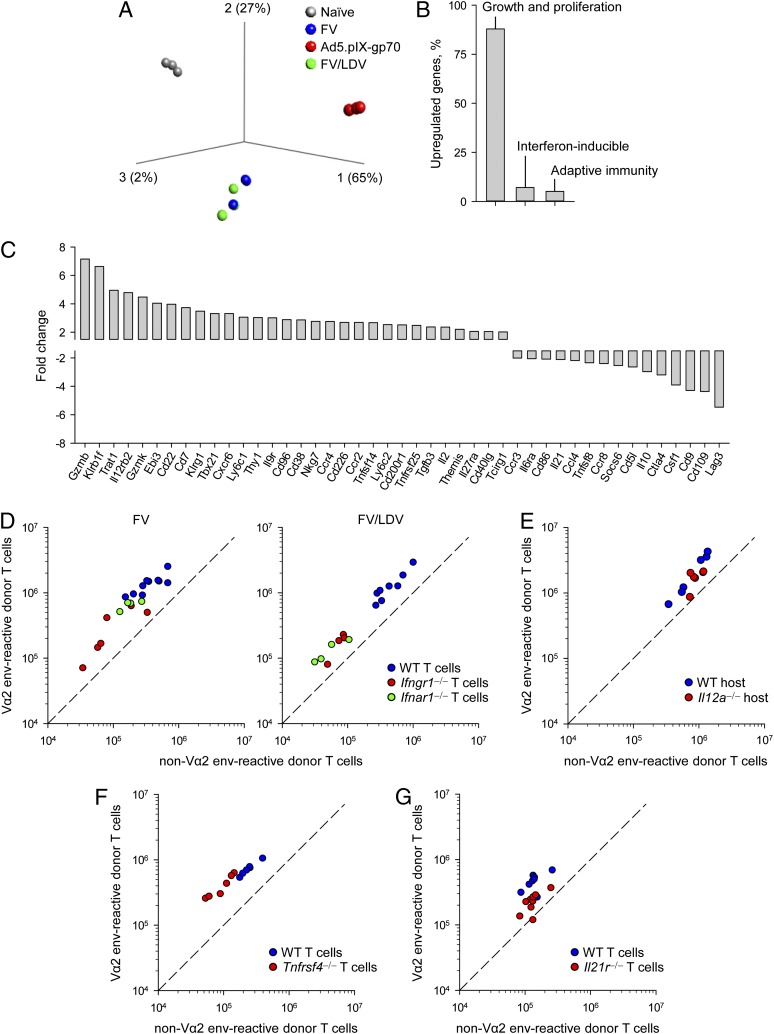
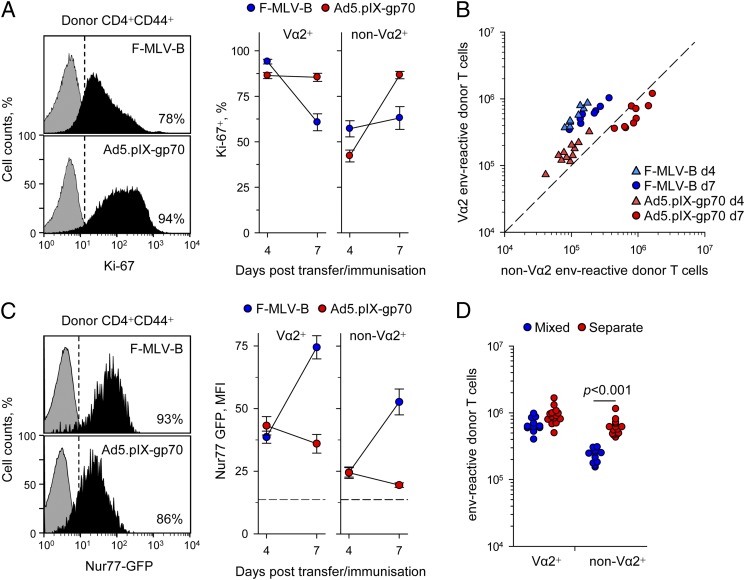
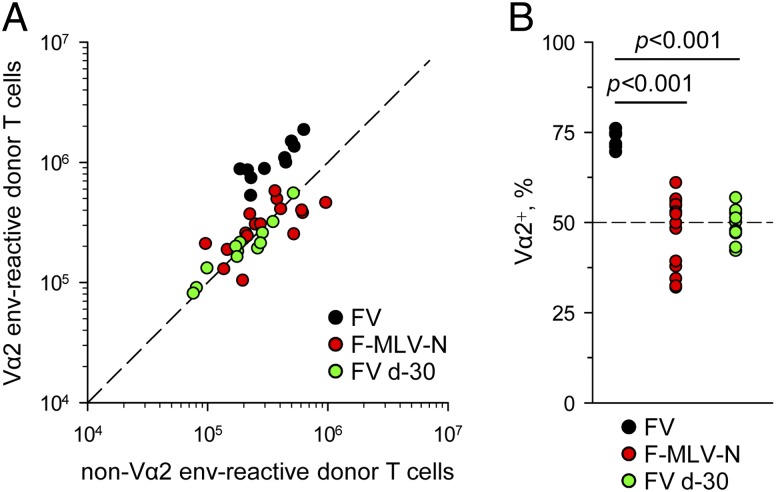
The mechanisms whereby different vaccines may expand distinct Ag-specific T cell clonotypes or induce disparate degrees of protection are incompletely understood. We found that several delivery modes of a model retroviral Ag, including natural infection, preferentially expanded initially rare high-avidity CD4(+) T cell clonotypes, known to mediate protection. In contrast, the same Ag vectored by human adenovirus serotype 5 induced clonotypic expansion irrespective of avidity, eliciting a predominantly low-avidity response. Nonselective clonotypic expansion was caused by relatively weak adenovirus serotype 5-vectored Ag presentation and was reproduced by replication-attenuated retroviral vaccines. Mechanistically, the potency of Ag presentation determined the speed and, consequently, completion of the CD4(+) T cell response. Whereas faster completion retained the initial advantage of high-avidity clonotypes, slower completion permitted uninhibited accumulation of low-avidity clonotypes. These results highlighted the importance of Ag presentation patterns in determining the clonotypic composition of vaccine-induced T cell responses and ultimately the efficacy of vaccination.


Figures

FIGURE 1.
FIGURE 1.
Ad5-vectored env uniquely induces low-avidity env-specific CD4+ T cells. (A) Absolute numbers of high-avidity Vα2 or low-avidity non–Vα2 donor env-specific EF4.1 CD4+ T cells in the spleens of recipient mice 7 d after adoptive transfer and indicated immunization. The diagonal dashed line represents equal proportion of the two subsets. (B) Representative flow cytometric profiles of CD4+CD44+ T cells from F-MLV-B–infected or Ad5.pIX-gp70–immunized recipient mice (day 7), distinguishing host (CD45.1+CD45.2+) and donor (CD45.1+CD45.2) EF4.1 cells (left) and the Vα2+ cells in the latter (right). (C) Frequency of Vα2+ cells in the same mice. (D) Representative flow cytometric staining of CD4+ T cells from F-MLV-B–infected or Ad5.pIX-gp70–immunized (day 7) nontransgenic mice with the Ab-env125–135 tetramer. (E) Absolute numbers of Ab-env125–135 tetramer-binding CD4+ T cells in the same mice. (F) Median fluorescence intensity (MFI) of Ab-env125–135 tetramer staining in the same samples. In (A), (C), (E), and (F), each symbol is an individual mouse. In (B)–(F), one of three experiments is shown.
FIGURE 2.
FIGURE 2.
Ad5.pIX-gp70 immunization induces low-avidity env-specific CD4+ T cells, irrespective of dose or route. (A) Absolute numbers of Vα2 or non–Vα2 donor env-specific EF4.1 CD4+ T cells in the spleens of recipient mice 7 d after immunization with the indicated dilutions of the standard Ad5.pIX-gp70 dose (4.5 × 10⁸ viral genomes/mouse). (B) Representative flow cytometric profiles for B-3T3 cells transduced with retroviral vectors encoding GFP under a CMV promoter (CMVp-GFP) or the LTR (LTR-GFP) transfected with Ad5.GFP 3 d earlier or left untreated (negative). Gates mark the arbitrary populations expressing low or high amounts of GFP. (C) Kinetics of GFP expression in the same cells as in (B) plotted as the frequency of GFP+ cells during 3 d of culture expressed as a fraction of the maximum frequency on day 3. (D) Intensity of GFP expression in the same cells as in (B) on day 3 of culture, plotted as the frequency of GFPbright cells within GFP+ cells only. Results in (B)–(D) are representative of four experiments. (E) Absolute numbers of Vα2 or non–Vα2 donor env-specific EF4.1 CD4+ T cells in the spleens (SP) or popliteal lymph nodes (LN) of recipient mice 7 d after i.v. F-MLV-B infection or i.v. or i.m. Ad5.pIX-gp70 immunization. (F) Frequency of Vα2+ cells in total env-specific EF4.1 CD4+ T cells in spleens and lymph nodes combined from the same mice as in (E). In (A), (E), and (F), each symbol is an individual mouse.
FIGURE 3.
FIGURE 3.
In vivo kinetics of Ag presentation following F-MLV-B infection or Ad5.pIX-gp70 immunization. (A) Absolute numbers of Vα2 or non–Vα2 donor env-specific EF4.1 CD4+ T cells in the spleens of recipient mice 7 d after immunization with the indicated combination of viruses at the time of T cell transfer. (B) Absolute numbers of Vα2 or non–Vα2 donor env-specific EF4.1 CD4+ T cells in the spleens of recipient mice 7 d after priming with Ad5.pIX-gp70 at the time of T cell transfer (day 0) followed by additional administration of either F-MLV-B or Ad5.pIX-gp70 on day 4. F-MLV-B infection or Ad5.pIX-gp70 immunization on day 0 was also included as control. (C) Representative flow cytometric profiles of CD4+ T cells, distinguishing host (CD45.1+CD45.2+) and donor (CD45.1+CD45.2) cells from the spleens of either control mice (H2-Ab1fl/fl) or mice lacking DC expression of MHC class II (H2-Ab1fl/fl × CD11c-Cre) 7 d following adoptive transfer of EF4.1 T cells and F-MLV-B infection or Ad5.pIX-gp70 immunization. Data are representative of two mice per genotype per virus. (D) CD69 expression in env-specific T cell hybridomas following overnight culture with the indicated number of DCs isolated from the spleens of F-MLV-B–infected or Ad5.pIX-gp70–immunized WT mice at the indicated times after immunization. Data are pooled from two experiments. (E) Absolute numbers of total splenic env-specific EF4.1 CD4+ T cells 7 d after transfer into recipient mice that had been immunized with Ad5.pIX-gp70 0, 2, or 6 d previously. The dashed line represents recovery from nonimmunized recipients. In (A), (B), and (E), each symbol is an individual mouse.
FIGURE 4.
FIGURE 4.
Gene expression and reliance of EF4.1 CD4+ T cells responding to FV infection or Ad5.pIX-gp70 immunization. (A) Principal component analysis plot of triplicated samples from naive EF4.1 CD4+ T cells and day 7 effector T cells in response to FV infection, Ad5.pIX-gp70 immunization, or FV and LDV coinfection. (B) Functional profiling of the 750 genes that were found >2-fold upregulated in Ad5.pIX-gp70– than in FV-primed effector EF4.1 CD4+ T cells, expressed as a percentage of the total. (C) Fold change of the 46 adaptive immunity–related genes that were found >2-fold differentially expressed between Ad5.pIX-gp70– and FV-primed effector EF4.1 CD4+ T cells. (D) Absolute numbers of splenic Vα2 or non–Vα2 donor env-specific EF4.1 CD4+ T cells 7 d after cotransfer of WT and either Ifngr1−/− or Ifnar1−/− EF4.1 CD4+ T cells into recipient mice infected with FV (left) or coinfected with FV and LDV (right). (E) Absolute numbers of splenic Vα2 or non–Vα2 donor env-specific EF4.1 CD4+ T cells 7 d after transfer into WT or Il12a−/− recipient mice infected with FV. (F) Absolute numbers of splenic Vα2 or non–Vα2 donor env-specific EF4.1 CD4+ T cells 7 d after cotransfer of WT and Tnfrsf4−/− EF4.1 CD4+ T cells into recipient mice infected with FV. (G) Absolute numbers of splenic Vα2 or non–Vα2 donor env-specific EF4.1 CD4+ T cells 7 d after cotransfer of WT and Il21r−/− EF4.1 CD4+ T cells into recipient mice infected with FV. p = 0.003 between the frequency of Vα2+ cells in WT and Il21r−/− EF4.1 CD4+ T cells (n = 11, Mann–Whitney rank sum test). In (D)–(G), each symbol is an individual mouse.
FIGURE 5.
FIGURE 5.
Proliferation kinetics of EF4.1 CD4+ T cells responding to FV infection or Ad5.pIX-gp70 immunization. (A) Representative flow cytometric assessment of Ki-67 expression on day 7 in donor env-specific EF4.1 CD4+ T cells (left) and frequency of Ki-67+ Vα2 or non–Vα2 donor env-specific EF4.1 CD4+ T cells 4 and 7 d after transfer into F-MLV-B–infected or Ad5.pIX-gp70–immunized recipients. Data are means of six to nine mice from three experiments. (B) Absolute numbers of splenic Vα2 or non–Vα2 donor env-specific EF4.1 CD4+ T cells 4 and 7 d after transfer into F-MLV-B–infected or Ad5.pIX-gp70–immunized recipients. (C) Representative flow cytometric assessment of Nur77-driven GFP expression on day 7 in donor env-specific EF4.1 CD4+ T cells (left) and mean fluorescence intensity (MFI) of GFP expression in Vα2 or non–Vα2 donor env-specific EF4.1 CD4+ T cells 4 and 7 d after transfer into F-MLV-B–infected or Ad5.pIX-gp70–immunized recipients. Data are means of eight mice from three experiments. The dashed line represents MFI of GFP signal in nonactivated cells. (D) Absolute numbers of splenic Vα2 or non–Vα2 donor env-specific EF4.1 CD4+ T cells 7 d after transfer into FV-infected recipients of either total EF4.1 CD4+ T cells, containing both Vα2 or non–Vα2 cells (mixed), or purified Vα2 or non–Vα2 EF4.1 CD4+ T cells separately (separate). In (B) and (D), each symbol is an individual mouse.
FIGURE 6.
FIGURE 6.
Effect of reduced F-MLV replication on the avidity of the env-specific CD4+ T cell response. (A) Absolute numbers of splenic Vα2 or non–Vα2 donor env-specific EF4.1 CD4+ T cells 7 d after transfer into recipient mice infected with FV or F-MLV-N at the time of T cell transfer or with FV 30 d prior to T cell transfer. (B) Frequency of Vα2+ cells in the same mice. In (A) and (B), each symbol is an individual mouse.

Similar articles

Cited by

References

    1. Welsh R. M., Selin L. K., Szomolanyi-Tsuda E. 2004. Immunological memory to viral infections. Annu. Rev. Immunol. 22: 711–743 - PubMed
    1. Zinkernagel R. M. 2003. On natural and artificial vaccinations. Annu. Rev. Immunol. 21: 515–546 - PubMed
    1. McMichael A. J., Borrow P., Tomaras G. D., Goonetilleke N., Haynes B. F. 2010. The immune response during acute HIV-1 infection: clues for vaccine development. Nat. Rev. Immunol. 10: 11–23 - PMC - PubMed
    1. Kaufmann S. H., McMichael A. J. 2005. Annulling a dangerous liaison: vaccination strategies against AIDS and tuberculosis. Nat. Med. 11(4, Suppl.): S33–S44 - PMC - PubMed
    1. Parks C. L., Picker L. J., King C. R. 2013. Development of replication-competent viral vectors for HIV vaccine delivery. Curr. Opin. HIV AIDS 8: 402–411 - PMC - PubMed

Publication types

MeSH terms