. 2014 Jul 3;10(7):e1004233.
doi: 10.1371/journal.ppat.1004233. eCollection 2014 Jul.

Systemic hematogenous maintenance of memory inflation by MCMV infection

Affiliations

Systemic hematogenous maintenance of memory inflation by MCMV infection

Corinne J Smith et al. PLoS Pathog. .

Abstract

Several low-grade persistent viral infections induce and sustain very large numbers of virus-specific effector T cells. This was first described as a response to cytomegalovirus (CMV), a herpesvirus that establishes a life-long persistent/latent infection, and sustains the largest known effector T cell populations in healthy people. These T cells remain functional and traffic systemically, which has led to the recent exploration of CMV as a persistent vaccine vector. However, the maintenance of this remarkable response is not understood. Current models propose that reservoirs of viral antigen and/or latently infected cells in lymph nodes stimulate T cell proliferation and effector differentiation, followed by migration of progeny to non-lymphoid tissues where they control CMV reactivation. We tested this model using murine CMV (MCMV), a natural mouse pathogen and homologue of human CMV (HCMV). While T cells within draining lymph nodes divided at a higher rate than cells elsewhere, antigen-dependent proliferation of MCMV-specific effector T cells was observed systemically. Strikingly, inhibition of T cell egress from lymph nodes failed to eliminate systemic T cell division, and did not prevent the maintenance of the inflationary populations. In fact, we found that the vast majority of inflationary cells, including most cells undergoing antigen-driven division, had not migrated into the parenchyma of non-lymphoid tissues but were instead exposed to the blood supply. Indeed, the immunodominance and effector phenotype of inflationary cells, both of which are primary hallmarks of memory inflation, were largely confined to blood-localized T cells. Together these results support a new model of MCMV-driven memory inflation in which most immune surveillance occurs in circulation, and in which most inflationary effector T cells are produced in response to viral antigen presented by cells that are accessible to the blood supply.


Conflict of interest statement

The authors have declared that no competing interests exist.

Figures
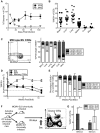
Figure 1
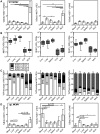
Figure 1. Effector-phenotype CD8s turnover continuously and undergo antigen-dependent division during MCMV-induced memory inflation.
(A) In C57BL/6 mice infected with K181 MCMV, M38-specific T cells accumulate over time while M45-specific T cells contract. Shown is the frequency of MCMV-specific CD8s in the blood over time, as measured by tetramer staining. (B) Inflationary T cells are also found in non-lymphoid organs. Shown is the frequency of M38-specific CD8s in the indicated organs of mice infected as in A, more than 3 months post infection. Each symbol represents an individual mouse. (C) Most inflationary T cells express an effector phenotype. Mice were infected as in A. The representative FACS plot (left) shows the KLRG1 and CD127 expression of M38-specific CD8s in the blood. The graph (right) shows the KLRG1 and CD127 expression of M38-specific T cells in organs more than 3 months post infection (n = 12, CLN  =  cervical lymph nodes, MLN  =  mediastinal lymph nodes). (D) Recently divided inflationary T cells are lost over time. B6 mice infected with K181 MCMV or WT-BAC MCMV for more than 3 months were pulsed with BrdU for 3 (n = 6) or 7 (n = 5) days. To account for mouse-to-mouse variation in the incorporation of BrdU, the data was normalized to the frequency of inflationary T cells that were BrdU-positive 7 days post-pulse. Shown is the proportion of M38- and IE3-specific CD8s that retained BrdU in the blood over time. Statistical significance was determined by comparing the proportion of cells retaining BrdU relative to the week 1 time point, using a paired student's t-test (*p<.05, **p<.01, ***p<.001). As a comparison, the same analysis was performed on total CD8 T cells (not antigen-specific) expressing CD127 and lacking KLRG1. Combined data from two independent experiments is displayed. (E) Recently divided inflationary T cells with an effector phenotype are lost over time. Shown is the phenotype of BrdU-positive M38-specific T cells at the indicated time points after BrdU pulse. Any data points with fewer than 25 labeled M38-specific T cells were excluded from the analysis at that time point. Statistical significance was determined as in “D” except that the proportion of BrdU-labeled cells expressing an effector phenotype was compared to the week 0 time point. (F) Adoptive transfer schematic. The representative FACS plot shows donor OT-Is, as a frequency of all CD8s, in the spleen of recipients 28 days after transfer. (G) Donor OT-Is with an effector phenotype only express Ki67 in the presence of cognate antigen. Shown is the Ki67 expression of effector-phenotype (KLRG1pos, CD127low) and memory-phenotype (KLRG-1neg, CD127pos) OT-Is in the spleen 28 days post transfer. Results are a combination of two independent experiments (n = 6 per group). Statistical significance was measured by an unpaired student's t-test (*p<.05). In all cases above, error bars represent the standard error of the mean.
Figure 2
Figure 2. Systemic division of inflationary CD8s.
C57BL/6 mice were infected with K181 MCMV for more than 3 months before organs were harvested for lymphocyte analyses. Mice were injected i.p. with 1 mg BrdU 16 hours before sacrifice. (A) Shown is the average frequency of Ki67 and BrdU co-stained M38-specific (left), IE3-specific (middle) and M45 (right) cells in the indicated organs 16 hours after BrdU injection. Error bars represent the standard error of the mean (n = 7). Statistical significance was measured by a paired student's t-test (*p<.05, **p<.01). (B) Number and (C) phenotype of Ki67-expressing T cells specific for M38 (left), IE3 (middle) and M45 (right), in the indicated organs. Error bars represent the standard error of the mean. Data are combined from 3 independent experiments and 12 animals. (D) Spread defective MCMV induces a similar pattern of division as wild type MCMV. C57BL/6 mice were infected with ΔgL-MCMV for more than 3 months and then injected with BrdU as in “A”. Data are displayed as in “A” and combined from two independent experiments (n = 8) Statistical significance was measured by a paired student's t-test (* p<.05).
Figure 3
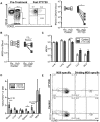
Figure 3. Short-term FTY720 treatment does not alter the pattern of division of inflationary cells.
Mice chronically infected with K181 were treated with FTY720 for one week and then injected with BrdU 16(A) Naïve T cells are lost from the blood during FTY720 treatment. The representative FACS plots show the expression of CD44 and CD62L on blood-localized CD8 T cells before (left) and after (right) FTY720 treatment. The graph shows the number of naïve CD8s per milliliter of blood in control and treated mice before and after the treatment. Each line represents an individual mouse (n = 5 per group). (B) M38-specific T cells are only slightly reduced with FTY720 treatment in some mice. Shown is the number of M38-specific CD8s per milliliter of blood in control and treated mice before and after the treatment period. (C) FTY720 treatment has a minimal effect on M38-specific CD8 T cells associated with various organs. Shown are the absolute numbers of M38-specific CD8 T cells harvested with the indicated organs of control (white) and FTY720 treated (grey) mice. (D) Dividing M38-specific T cells are detected systemically even after FTY720 treatment. Shown is the frequency of M38-specific CD8s associated with the indicated organs that were Ki67-positive and labeled with BrdU. (E) Dividing M38-specific T cells are still predominantly effector phenotype. The representative FACS plots show KLRG1 and CD127 expression of M38-specific T cells (left panels) and the dividing M38-specific population in the blood (right panels) for FTY720 treated mice (top panels) and control mice (bottom panels). Data is pooled from two independent experiments (n = 5 per group). In all cases, error bars represent the standard error of the mean. Statistical significance was measured by paired (A and B) or unpaired (C and D) student's t-test (*p<.05).
Figure 4
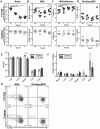
Figure 4. Long-term FTY720 treatment does not alter the maintenance of memory inflation.
Mice infected with K181 MCMV for more than 3 months were treated with FTY720 in their drinking water for five weeks. Mice were injected with BrdU 16(A–D) The M38-specific T cell population is stable in the blood of mice during prolonged FTY720 treatment. Shown is (A) the number of naïve CD8s per milliliter of blood, (B) the number of M38-specific CD8s per milliliter of blood, (C) the percentage of blood-localized M38-specific CD8s expressing the effector phenotype (KLRG1pos, CD127low), and (D) the frequency of Ki67-positive M38-specific CD8s in the blood before and during the time course in treated mice (top) and controls (bottom). (E–G) Prolonged FTY720 treatment does not alter the number, division, or phenotype of dividing M38-specific T cells associated with the organs. Shown are (E) the absolute numbers of M38-specific CD8s and (F) the frequency of M38-specific T cells that were Ki67-positive and labeled with BrdU in control (white) and FTY720 treated (grey) mice. The representative FACS plots (G) show the KLRG1 and CD127 expression of M38-specific T cells (left panels) and dividing Ki67-positive M38-specific population (right panels) in the blood of FTY720 treated (top panels) and control mice (bottom panels) at the end of the treatment period. In all cases, error bars represent the standard error of the mean (n = 5 per group). Statistical significance was measured by paired (A–D) and unpaired (E–F) student's t-tests (*p<.05, **p<.01, ***p<.001).
Figure 5
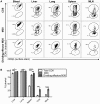
Figure 5. Most inflationary CD8s are exposed to the blood supply.
Mice infected with K181 MCMV for more than 3 months were injected with fluorochrome labeled anti-CD8α antibody to identify T cells exposed to the blood supply. After perfusion and processing the organs, cells were counterstained with anti-CD8β, to identify all CD8 T cells. (A) Shown is representative FACS staining with the injected antibody for all CD8s (top), M38-specific CD8s (middle), and dividing effector-phenotype M38-specific CD8s (bottom) in the blood, spleen, liver, lung and mediastinal lymph nodes. (B) Graph shows mean frequency of cells labeled by i.v. staining for all CD8s, M38-specific CD8s, and dividing effector-phenotype M38-specific CD8s for the indicated organs. Data are pooled from 4 independent experiments (n = 15) and representative of seven independent experiments. Statistical significance was measured by paired student's t-tests (*p<.05, **p<.01, ***p<.001, **** p<.0001). Error bars represent the standard error of the mean.
Figure 6
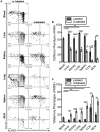
Figure 6. Inflationary cells exposed to the blood are phenotypically distinct from those that are not.
Mice infected with K181 MCMV for more than 3 months were injected with fluorochrome labeled anti-CD8α antibody to identify T cells exposed to the blood supply. (A) Representative FACS plots of KLRG1 and CD127 expression on M38-specific CD8s in the labeled (left) and unlabeled (right) fractions of the indicated organs. (B and C) Graphs show the mean frequency of M38-specific cells within the labeled or unlabeled fraction of the indicated organs that express (B) an effector phenotype (KLRG1pos, CD127low) or (C) a memory phenotype (KLRG-1neg, CD127pos). Data is pooled from three independent experiments (n = 12). Error bars represent the standard error of the mean. Statistical significance was measured by paired student's t-test (*p<.05**p<.01, ***p<.001, **** p<.0001).
Figure 7
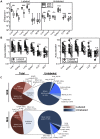
Figure 7. The numerical dominance of inflationary cells is only evident within the blood exposed T cell population.
Mice infected with K181 MCMV for more than 3 months were injected with fluorochrome labeled anti-CD8α antibody to identify T cells exposed to the blood supply. (A) Absolute numbers of M38- and M45-specific in the labeled fraction (left panel) and unlabeled fraction (right panel) in the indicated organs. Error bars represent the standard error of the mean. (B) The ratio of M38-specific to M45-specific CD8s was derived from numbers shown in 7A. The left panel compares this ratio in the labeled and unlabeled fractions within each organ. Each line connects the populations found in an individual mouse (n = 15). The right panel shows the same comparison between IE3-specific (inflationary) and M57-specific (non-inflationary) CD8s using numbers derived from Figure S6D. Statistical significance was measured by paired student's t-test (*p<.05**p<.01, ***p<.001, **** p<.0001). (C) A global picture of MCMV-specific CD8 distribution was determined by calculating the average number of tetramer stained cells in the labeled and unlabeled compartments of the spleen, liver, lung, cervical and mediastinal lymph nodes, kidney, female reproductive tract, salivary gland, and mammary gland (n = 7−15). (C) The left panel shows the fraction of the total tetramer positive population that is localized to each site for M38-specific (top) and M45-specific CD8s (bottom). The blood localized fractions for each organ are displayed in red and the unlabeled fractions are displayed in blue. The right panel shows the distribution of only the cells that are shielded from i.v. staining. The numbers represent the percentage of cells at each site out of the total tetramer specific population.

Similar articles

Cited by

References

    1. Koffron A, Hummel M, Patterson B, Yan S, Kaufman D, et al. (1998) Cellular Localization of Latent Murine Cytomegalovirus. J Virol 72: 95–103. - PMC - PubMed
    1. Jarvis MA, Nelson JA (2002) Human cytomegalovirus persistence and latency in endothelial cells and macrophages. Curr Opin Microbiol 5: 403–407. - PubMed
    1. Jarvis MA, Nelson JA (2007) Human cytomegalovirus tropism for endothelial cells: not all endothelial cells are created equal. J Virol 81: 2095–2101. - PMC - PubMed
    1. Mercer J, Wiley C, Spector D (1988) Pathogenesis of Murine Cytomegalovirus Infection: Identification of Infected Cells in the Spleen during Acute and Latent Infections. J Virol 62: 987–997. - PMC - PubMed
    1. Pomeroy C, Hilleren P, Jordan M (1991) Latent Murine Cytomegalovirus DNA in Splenic Stromal Cells of Mice. J Virol 65: 3330–3334. - PMC - PubMed

Publication types

Substances