Review
. 2014 Jul;94(3):951-86.
doi: 10.1152/physrev.00038.2013.

The physiology of mechanoelectrical transduction channels in hearing

Affiliations
Review

The physiology of mechanoelectrical transduction channels in hearing

Robert Fettiplace et al. Physiol Rev. 2014 Jul.

Abstract

Much is known about the mechanotransducer (MT) channels mediating transduction in hair cells of the vertrbrate inner ear. With the use of isolated preparations, it is experimentally feasible to deliver precise mechanical stimuli to individual cells and record the ensuing transducer currents. This approach has shown that small (1-100 nm) deflections of the hair-cell stereociliary bundle are transmitted via interciliary tip links to open MT channels at the tops of the stereocilia. These channels are cation-permeable with a high selectivity for Ca(2+); two channels are thought to be localized at the lower end of the tip link, each with a large single-channel conductance that increases from the low- to high-frequency end of the cochlea. Ca(2+) influx through open channels regulates their resting open probability, which may contribute to setting the hair cell resting potential in vivo. Ca(2+) also controls transducer fast adaptation and force generation by the hair bundle, the two coupled processes increasing in speed from cochlear apex to base. The molecular intricacy of the stereocilary bundle and the transduction apparatus is reflected by the large number of single-gene mutations that are linked to sensorineural deafness, especially those in Usher syndrome. Studies of such mutants have led to the discovery of many of the molecules of the transduction complex, including the tip link and its attachments to the stereociliary core. However, the MT channel protein is still not firmly identified, nor is it known whether the channel is activated by force delivered through accessory proteins or by deformation of the lipid bilayer.


Figures

FIGURE 1.
FIGURE 1.
The auditory organ in three vertebrate classes. The spatial map of best or characteristic frequencies (CF) of neurons along the basilar membrane, often referred to as the tonotopic map, is illustrated for members of three vertebrate classes: A, basilar papilla of the red-eared turtle, Trachmemys scripta elegans; B, basilar papilla of the chicken, Gallus gallus domesticus; C, cochlea of the rat, Rattus norvegicus. The CFs are expressed in kHz, with the frequency range being ∼30–600 Hz in turtle (47); 100 Hz to 4 kHz in chicken (33, 118), and 1–60 kHz in rat (175). Transverse sections across the hair cell epithelium are schematized on the right. D: turtle papilla contains a single type of hair cell innervated by both afferent (red) and efferent (blue) nerve fibers. E: chicken papilla contains two extremes of hair cell: on the neural aspect tall hair cells innervated mainly by afferents and on the abneural aspect short hair cells innervated predominantly by efferents. Although not shown, in both turtle and chicken, each afferent collects from only one or two hair cells. F: rat cochlea, similar to other mammals, contains three rows of outer hair cells with efferent innervations, and one row of inner hair cells innervated by 95% of the auditory afferents.
FIGURE 2.
FIGURE 2.
Structure of the stereociliary bundle. A: scanning electron micrograph of the hair bundle from a turtle auditory hair cell exhibiting nine rows of stereocilia of incremental heights and a kinocilium, arrowed (90). B: rat OHC showing only three rows of stereocilia. C: rat IHC illustrating the tall first row of stereocilia that can behave like a “flag” to fluid flow in the subtectorial space and the shorter and more numerous second, third, and fourth rows (18). D: bat inner hair cell from the high-frequency region of the cochlea showing only two rows of stereocilia. Scale bar = 1 μm for A and 2 μm for B–D. (Micrographs in A, B, and D courtesy of C. M. Hackney and D. N. Furness.)
FIGURE 3.
FIGURE 3.
The tip link and connections. A: transmission electron micrograph of a guinea pig outer hair cell illustrating the tip link and the electron-dense regions at the upper and lower ends, denoted as the upper tip-link density (UTLD) and lower tip-link density (LTLD), respectively. Note the membrane has pulled away from the LTLD where it attaches to the tip link, and there is an electron-dense “contact region” where the shorter stetereocilium abuts the taller one. This may be the site of the top connectors. Scale bar = 0.2 μm. B: one theoretical scheme for the connections of the MT channel, where two channels float free in the plasma membrane. C: another scheme where each MT channel is attached to one strand of the tip link and is also anchored to the internal cytoskeleton by an “adaptation spring.” Two intermediate arrangements have been proposed in which the MT channels are connected only to the tip link or only to the internal cytoskeleton (194).
FIGURE 4.
FIGURE 4.
MT currents in mouse apical OHCs obtained using two different methods of hair bundle stimulation. A: deflections with a glass probe attached to a piezoelectric actuator, MT currents for step displacements of bundle, ΔX, shown at top. B: relationship between the peak MT current and bundle displacement, ΔX; the experimental points were fitted with a single-stage Boltzmann equation with 10–90% working range (WR) of 280 nm. C: onset of MT current to a 130-nm step showing that the current develops with the same time course as the stimulus but then undergoes fast adaptation with a time constant of 0.15 ms. D: hair bundle stimulation with a fluid jet, MT currents shown below and bundle motion above; the smooth curve is the 40-Hz sinusoidal driving voltage, and the noisy gray trace is the photodiode signal used to calibrate the movements. E: current-displacement relationship for first cycle of response in D, fitted with a single-stage Boltzmann equation with WR = 25 nm. In both sets of recordings, the holding potential was −84 mV, and the Ca2+ concentration in the extracellular solution was 1.5 mM.
FIGURE 5.
FIGURE 5.
Two-step analysis of fast adaptation in a rat OHC. A: family of MT currents (controls) in response to 2-ms step deflections of the hair bundle with a glass probe driven by a piezoactuator. B: MT currents for 2-ms step deflections of the hair bundle superimposed on a 0.4-μm maintained adapting step; these stimuli were interleaved with the control measurements as indicated by the time axis at a stimulus repetition of 30 Hz. C: current-displacement (I-X) relationship for the control measurements (○) and the adapted measurements (●). Note the effect of adaptation is to reset rapidly the working range by shifting the I-X relation along the displacement axis by approximately the same amount as the adapting step; holding potentials, −84 mV. D: schematic of the effects of intracellular Ca2+ on the position of the I-X relationship along the displacement axis. Elevated Ca2+, as occurs during adaptation, shifts the I-X relationship from its resting position, denoted by dashed curve, to larger displacements. Reduction in intracellular Ca2+ during lowering external Ca2+ or depolarization translates the I-X relationship to smaller displacements.
FIGURE 6.
FIGURE 6.
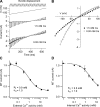
Rectification and Ca2+ block in MT channels of mouse OHCs. A: apical OHC in which hair bundles were deflected with a sinusoidal fluid jet stimulus (top) superimposed on a voltage ramp from −150 to +100 mV (middle), MT currents being recorded in an extracellular saline containing 1.5 mM Ca2+ (perilymph) or 0.02 mM in Ca2+ (endolymph). The continuous line through the MT currents is the current-voltage response in the absence of bundle stimulation; note that in the low Ca2+, the resting open probability of the channels (PO,r) is ∼0.5. B: current-voltage relationships for an apical OHC in 1.5 mM Ca2+ and 0.02 mM Ca2+. The effect of reducing external Ca2+ concentration is to remove block at negative membrane potentials and produce a more marked inwardly rectifying relationship. C: block of MT channel as a function of the extracellular Ca2+ concentration. Mean ± SE of the MT current at −84 mV is plotted against the Ca2+ activity; intracellular solution contains 142 mM CsCl and 1 mM EGTA. Points fitted with a Hill equation with half-blocking concentration, KI = 0.9 mM and Hill coefficient, nH = 1.0. D: block of MT channel as a function of intracellular Ca2+ activity. Mean ± SE of the MT current at −84 mV is plotted against the Ca2+ activity; extracellular solution contains 160 mM NaCl and 0.02 mM Ca2+. The lowest intracellular Ca2+ activity is equivalent to 1 mM EGTA. Points fitted with a Hill equation with KI = 2.5 mM and nH = 1.0.
FIGURE 7.
FIGURE 7.
Tonotopic variation in the MT conductance and K+ conductance in rodent OHCs. A: schematic of an OHC illustrating the two principal ionic currents that determine the resting potential. An inward current (IMT) flows through open MT channels, the electrical driving force resulting from the positive endolymphatic potential (EP = +90 mV) and the negative resting potential, −40 to −50 mV. The MT channels are partially open due to a low endolymph Ca2+ of 0.02 mM. B: maximum MT conductance (GMT) in endolymph Ca2+ as a function of the CF of the cochlear location: ●, gerbil; ■, rat. C: maximum voltage-dependent K+ conductance (GK) as a function of the CF of the cochlear location: ●, gerbil; ■, rat. The K+ current in hearing animals older than P12 is dominated by IK,n flowing through KCNQ4-containing channels in the OHC basolateral membrane. Measurements are from Johnson et al. (116), extrapolated to the in vivo condition including a body temperature of 37°C.
FIGURE 8.
FIGURE 8.
Tonotopic variation in the MT currents in hair cells of the chicken auditory papilla. A: MT currents in three short hair cells in response to fluid jet deflections of the hair bundle; holding potential is −84 mV. Sinusoidal driving voltage to the fluid-jet is shown at the top. Cell locations in the epithelium given beside traces as the fractional distance (d) from the apical end of the papilla (d = distance from the apex scaled by the total length of papilla, ∼3.6 mm). B: collected peak amplitudes of MT currents versus location for tall and short hair cells at 33°C. Line is exponential fit to all points. Tonotopic variation in the number of stereocilia per bundle (crosses referred to the right hand axis) replotted from the data of Tilney and Sauders (248). C: MT current per stereocilium (continuous line) derived from the data in B by dividing the fit to the experimental MT currents by the fit to the number of stereocilia per bundle. MT current per tip link (dashed line) derived by dividing the continuous line by 0.88, the approximate ratio of tip-links to stereocilia in a chicken hair bundle. [Modified from Tan et al. (246).]
FIGURE 9.
FIGURE 9.
Active force generation in turtle auditory hair cells. A: one model of the MT channel fast adaptation. The channel is anchored to the tip link and to the cytoskeleton by springs, GS and GS', respectively. Bundle deflection causes force to be applied via the tip link. This extends the spring and opens the channel allowing influx of Ca2+ which binds to the channel and/or the cytoskeletal spring causing channel reclosure. Closing of the channel exerts force on the tip link which pulls the bundle back in the negative direction. B: a force step applied to a turtle auditory hair cell bundle with a flexible fiber elicits a positive bundle deflection (monitored by imaging the bundle on a photodiode pair) and an inward MT current. As the current adapts, the bundle moves back in the negative direction, with a parallel time course. C: the time constant of the hair bundle recoil decreases with hair cell location along the papilla towards the high frequency end. [Modified from Ricci et al. (203).]
FIGURE 10.
FIGURE 10.
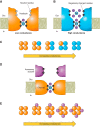
Hypothetical structure of the MT channel illustrating the ion conduction pathway. A: cross-section of a channel showing a large vestibule on the external aspect of the channel and a tight selectivity filter lined with negatively charged residues at the cytoplasmic end of the channel. It is proposed that in the low-conductance isoform, there are critical neutral residues in the vestibule. B: in the high-conductance isoform of the channel, these neutral residues are replaced with negatively charged residues that cause accumulation of ions in the vestibule, hence increasing channel conductance (18). C: one scheme for generating a range of single-channel conductances by mixing the low-conductance and high-conductance isoforms in A and B in a tetrameric channel, assuming properties are a linear function of subunit composition. D: in a second model, the MT channel comprises a pore-forming modulated by an accessory subunit with negatively charged residues to generate a high-conductance isoform as in B. E: a scheme using the second model for producing a range of unitary conductances, in which different numbers of accessory subunits, such as LHFPL5 or TMC1, associate with the channel to systematically vary its properties (see sect. VIB).
FIGURE 11.
FIGURE 11.
Experimental records of single MT channels. A: method of isolating single-channel events by recording in whole cell configuration in which the majority of the tip links have been destroyed by exposure to BAPTA. B: single-channel events in an apical rat IHC during imposition of a displacement step to the hair bundle, the timing of which is given above. Four representative traces are shown illustrating evoked transitions from closed (C) to open (O) state. The ensemble average of 12 stimuli is shown below displaying fast adaptation. The amplitude histogram of the events indicates a single-channel current of 16 pA corresponding to a conductance of 190 pS. C: single-channel events in an OHC from the middle turn of a rat cochlea, the timing of the displacement step to the hair bundle being given above. The ensemble average also displays adaptation, and the amplitude histogram of the events indicates a single-channel current of 11 pA, equivalent to a conductance of 131 pS. In B and C, the holding potential was −84 mV, and measurements were made at room temperature. [B and C from Beurg et al. (18).]
FIGURE 12.
FIGURE 12.
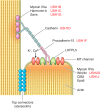
Schematic of the tip link and its attachments at the top of a shorter stereocilium and at the side wall of its taller neighbor. The prevailing view of the molecular composition of the transduction complex (see text) is illustrated, including the tip link (124), the upper tip-link densities (tripartite complex of myosin-7a, harmonin-b, and sans; Ref. 85) and the lower tip-link densities (myosin XVa, whirlin, and Eps8; Refs. 53, 16, 161) and CIB2 (Ca2+ and integrin binding protein isoform 2; Ref. 201). Many of the proteins are mutated in Usher syndrome. In addition, the MT channel is localized to the lower end of the tip link (19), with LHFPL5 (also known as TMHS, Ref. 271) as a possible coupling protein.
FIGURE 13.
FIGURE 13.
Single mechantransducer channels in mouse cochlear hair cells. A: examples of single-channel currents recorded in an apical OHC for step hair-bundle deflections, stimulus monitor shown above; closed (C) and open (O) states are indicated beside traces. B: amplitude histogram of events like those in A, giving single-channel current of −5.2 pA at −84 mV holding potetnial. C: single-channel currents in a basal OHC for step hair-bundle deflections. D: amplitude histogram of events like those in C, giving single-channel current of −8.5 pA at −84 mV holding potetnial. E: mean single-channel currents (left axis) and conductance (right axis) ± SD, plotted against cochlear location, expressed as the fraction of the distance along the basilar membrane from the low-frequency apical end. The current is larger at the base for wild-type OHC but not for Tmc1−/− OHC in which the tonotopic gradient is virtually abolished. Number of cells: wild-type OHC apex, 6; middle, 5; base, 6; OHC from deafness mutant, Tmc1dn/dn: apex 17, middle 3, base 7. Mouse age range was P2 to P6.

Similar articles

Cited by

References

    1. Abe T, Kakehata S, Kitani R, Maruya S, Navaratnam D, Santos-Sacchi J, Shinkawa H. Developmental expression of the outer hair cell motor prestin in the mouse. J Membr Biol 215: 49–56, 2007 - PMC - PubMed
    1. Ahmed ZM, Goodyear R, Riazuddin S, Lagziel A, Legan PK, Behra M, Burgess SM, Lilley KS, Wilcox ER, Riazuddin S, Griffith AJ, Frolenkov GI, Belyantseva IA, Richardson GP, Friedman TB. The tip-link antigen, a protein associated with the transduction complex of sensory hair cells, is protocadherin-15. J Neurosci 26: 7022–7034, 2006 - PMC - PubMed
    1. Algramam KN, Goodyear RJ, Geng R, Furness DN, van Aken AF, Marcotti W, Kros CJ, Richardson GP. Mutations in protocadherin 15 and cadherin 23 affect tip links and mechanotransduction in mammalian sensory hair cells. PLoS One 6: e19183, 2011 - PMC - PubMed
    1. Alharazneh A, Luk L, Huth M, Monfared A, Steyger PS, Cheng AG, Ricci AJ. Functional hair cell mechanotransducer channels are required for aminoglycoside ototoxicity. PLoS One 6: e22347, 2011 - PMC - PubMed
    1. Anishkin A, Kung C. Stiffened lipid platforms at molecular force foci. Proc Natl Acad Sci USA 110: 4886–4892, 2013 - PMC - PubMed

Publication types