. 2014 Jul;24(7):1209-23.
doi: 10.1101/gr.159384.113.

Comparative validation of the D. melanogaster modENCODE transcriptome annotation

Affiliations

Comparative validation of the D. melanogaster modENCODE transcriptome annotation

Zhen-Xia Chen et al. Genome Res. 2014 Jul.

Abstract

Accurate gene model annotation of reference genomes is critical for making them useful. The modENCODE project has improved the D. melanogaster genome annotation by using deep and diverse high-throughput data. Since transcriptional activity that has been evolutionarily conserved is likely to have an advantageous function, we have performed large-scale interspecific comparisons to increase confidence in predicted annotations. To support comparative genomics, we filled in divergence gaps in the Drosophila phylogeny by generating draft genomes for eight new species. For comparative transcriptome analysis, we generated mRNA expression profiles on 81 samples from multiple tissues and developmental stages of 15 Drosophila species, and we performed cap analysis of gene expression in D. melanogaster and D. pseudoobscura. We also describe conservation of four distinct core promoter structures composed of combinations of elements at three positions. Overall, each type of genomic feature shows a characteristic divergence rate relative to neutral models, highlighting the value of multispecies alignment in annotating a target genome that should prove useful in the annotation of other high priority genomes, especially human and other mammalian genomes that are rich in noncoding sequences. We report that the vast majority of elements in the annotation are evolutionarily conserved, indicating that the annotation will be an important springboard for functional genetic testing by the Drosophila community.


Figures

Figure 1.
Figure 1.
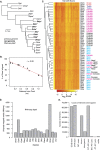
Genome assemblies and RNA-seq. (A) Bayesian phylogenetic tree of 20 sequenced Drosophila species (four letter abbreviations). All nodes are supported by 100% posterior probabilities. Scale bar indicates phylogenetic distance in substitutions per site (ss). Previously (italics) and newly assembled (bold italics) genomes, and those with supporting RNA-seq data (asterisk) are indicated. (B) Scatterplot showing alignment versus phylogenetic distance from D. melanogaster (linear trendline in red). (C) Heatmap and hierarchical clustering of expression values for 3223 first coding exons from the indicated samples. Adult ovary (dark red) and testis (dark blue) included developing germ cells and somatic gonadal cells and internal reproductive tracts derived from the genital disc. Females (pink) and males (light blue) were whole adults, embryos were unsexed, heads were from adults, and carcasses were all adult tissues remaining after removal of the gonads and internal reproductive tract. RPKM scale is shown for 15 species. The distance scale for hierarchical leaves was arbitrary. (D) Sequencing depth by species. A limited number of RNA-seq reads from heads (20.5 million reads for D. melanogaster, 28.4 million reads for D. pseudoobscura, and 51.6 million reads for D. mojavensis) were previously published (Graveley et al. 2011). The remaining reads are reported here for the first time. (E) The number of each element type from the modENCODE version 2 (MDv2) annotation. We examined the conserved sequence and expression characteristics of all such elements. For purposes of analysis, exons with both UTR and CDS sequences were split.
Figure 2.
Figure 2.
Exon validation. (A) Percentage of MDv2-annotated CDS exons (black), UTR exons (orange), ncRNA exons (green), introns (blue), and intergenic regions (red) that align in the indicated genome. (B) Percentage of aligned regions expressed (95% element coverage). (C) Percentage of aligned and expressed for each element type in each non-melanogaster species, plotted against phylogenetic distance from D. melanogaster (Fig. 1E; Supplemental Tables S6–S10). (D) The distribution of aligned and expressed features in RNA-seq samples. (E) Gene model for Ncc69 showing transcription start (arrow), UTR regions (orange fill), CDS (black fill), and introns (black line). Expression of MDv2 exon mdcds_25302 (red asterisk) and flanking region (upstream 300 bp and downstream 150 bp) in 13 species. Log2 scale RNA-seq coverage (arbitrary scale for illustration) in whole adult males of the indicated species.
Figure 3.
Figure 3.
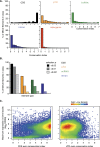
Exon conservation. (A) Frequency of conservation index (CI) scores for MDv2-annotated CDS exons (black), UTR exons (orange), ncRNA exons (green), introns (blue), and intergenic regions (red). (B) Frequency of probabilities that CI scores for CDS exons (shades of black), UTR exons (shades of orange), NC exons (shades of green), and introns (shades of blue) were similar to those of intergenic regions. The P-value is shown in the key (0.05, 0.01, 0.001 from left to right for each element) (Fig. 1E; Supplemental Tables S6–S10). (C) Density plots illustrating the relationship between CDS and UTR exons’ CI and maximum element gene-level expression values (FPKM) in D. melanogaster adults.
Figure 4.
Figure 4.
Transcription start site motifs. (A) Sequence logos centered on the “CA” motif (where A = +1 of CAGE sites) derived from the peak distribution of CAGE reads from each D. melanogaster and D. pseudoobscura sample. CAGE-seq used the same mRNA samples as RNA-seq (Fig. 1C). (B) K-means clustering of sequences flanking the CAGE site sequences (A, red; C, green; G, blue; T, orange). Promoter regions lacking obvious structure are not shown. Regulatory motifs (white text) in each cluster are indicated (delineated by white dashed lines).
Figure 5.
Figure 5.
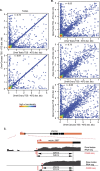
Transcription start site position. (A,B) Density plot (color scale) of distance between translation start (encoding the first AUG of the open reading frame) and CAGE site between D. melanogaster tissues or species (see Supplemental Files S1–S8 for browser-ready CAGE data files). (C) CAGE site examples for the chinmo locus expression in testes. UTR (orange fill) and CDS exons (black), annotated TSS (red arrow), CAGE sites (red), and RNA-seq read density (black) do not align, but there is clear evidence of these structures from RNA-seq (black). Aligned and presumably orthologous CAGE sites (red asterisk) are shown. Double-ended arrows indicate distance from CDS to the CAGE sites.
Figure 6.
Figure 6.
RNA splicing validation. (A) D. melanogaster MDv2 GT-AG (black) and GC-AG (green) splice junctions (recognized by U2 spliceosomes) and AT-AC splice junctions (red) (recognized by U12 spliceosomes) that align to the indicated genomes. (B) Aligned elements expressed (≥1 junction spanning read). (C) Combined sequence and expression conservation for each element type plotted against distance from D. melanogaster. (D) An example of a validated splicing event in a transcript model of the pollux gene. (Upper panel) An exon previously annotated as constitutive is annotated as an alternatively spliced cassette in MDv2 (red asterisk). (Lower panels) RNA-seq read coverage (black), and junction coverage with percent spliced in (PSI) values for the cassette exon inclusion (upper dotted lines) and exclusion (lower dotted lines) isoforms in adult females of the indicated species. Additional species also showed this splicing pattern (not shown). (E) Density plots of female/male ▵PSI values for species (and two strains in the case of D. simulans) plotted against D. melanogaster female/male ▵PSI values.
Figure 7.
Figure 7.
RNA splicing conservation. (A) Frequency of CI scores for MDv2 annotated GT-AG (black) and GC-AG (green) splice junctions (recognized by U2 spliceosomes) and AT-AC splice junctions (red) (recognized by U12 spliceosomes). (B) Frequency of probabilities that the exon conservation indexes for GT-AG junctions (shades of black), GC-AG junctions (shades of green), and AT-AC junctions (shades of red) were similar to intergenic regions (Supplemental Table S13). The P-value column order for each element is shown in the key (0.05, 0.01, and 0.001 from left to right for each element). (C) Density plot illustrating the relationship between the mean CDS exon and junction conservation index scores within a gene.
Figure 8.
Figure 8.
RNA editing. (A) D. melanogaster editing events that align to the indicated genomes (black) and are used if aligned (blue). (B) Combined sequence and expression conservation for editing events. (C) Frequency of conservation index scores for MDv2-annotated edits. (Inset) Probability that CI is random (shades of black). (D) An example of a validated editing site in moleskin with a low CI. Gene model and log2 scale RNA-seq coverage in adult males with editing site are indicated (red asterisk). (E) Genome alignment of moleskin editing site (red asterisk) and flanking region. (D,E) Nucleotides are color coded (I, light blue; A, red; C, green; G, blue; T, orange). (F) Stacked bar plot of editing site base calling in D. melanogaster, D. simulans, D. yakuba, and D. kikkawai. (G) Frequencies of editing occurrence among transcripts from genes with annotated alternative transcription start sites (Alt. TSS), alternative splicing (Alt. Spliced), both alternative transcription start sites and splicing (Alt. TSS & Alt. Spliced), multiexon genes with a single annotated isoform, and single exon genes. All D. melanogaster genes (gray), those with edits in at least one other species (dark blue), and those with edits only in D. melanogaster (light blue) are shown.

Similar articles

Cited by

References

    1. Adams MD, Celniker SE, Holt RA, Evans CA, Gocayne JD, Amanatides PG, Scherer SE, Li PW, Hoskins RA, Galle RF, et al. 2000. The genome sequence of Drosophila melanogaster. Science 287: 2185–2195 - PubMed
    1. Andrews J, Bouffard GG, Cheadle C, Lu J, Becker KG, Oliver B 2000. Gene discovery using computational and microarray analysis of transcription in the Drosophila melanogaster testis. Genome Res 10: 2030–2043 - PMC - PubMed
    1. Balakirev ES, Ayala FJ 2003. Pseudogenes: are they “junk” or functional DNA? Annu Rev Genet 37: 123–151 - PubMed
    1. Banerji J, Olson L, Schaffner W 1983. A lymphocyte-specific cellular enhancer is located downstream of the joining region in immunoglobulin heavy chain genes. Cell 33: 729–740 - PubMed
    1. Bass B, Hundley H, Li JB, Peng Z, Pickrell J, Xiao XG, Yang L 2012. The difficult calls in RNA editing. Nat Biotechnol 30: 1207–1209 - PubMed

Publication types

MeSH terms

Substances