. 2014 Jun 27;9(6):e100554.
doi: 10.1371/journal.pone.0100554. eCollection 2014.

Population distribution analyses reveal a hierarchy of molecular players underlying parallel endocytic pathways

Affiliations

Population distribution analyses reveal a hierarchy of molecular players underlying parallel endocytic pathways

Gagan D Gupta et al. PLoS One. .

Erratum in

Abstract

Single-cell-resolved measurements reveal heterogeneous distributions of clathrin-dependent (CD) and -independent (CLIC/GEEC: CG) endocytic activity in Drosophila cell populations. dsRNA-mediated knockdown of core versus peripheral endocytic machinery induces strong changes in the mean, or subtle changes in the shapes of these distributions, respectively. By quantifying these subtle shape changes for 27 single-cell features which report on endocytic activity and cell morphology, we organize 1072 Drosophila genes into a tree-like hierarchy. We find that tree nodes contain gene sets enriched in functional classes and protein complexes, providing a portrait of core and peripheral control of CD and CG endocytosis. For 470 genes we obtain additional features from separate assays and classify them into early- or late-acting genes of the endocytic pathways. Detailed analyses of specific genes at intermediate levels of the tree suggest that Vacuolar ATPase and lysosomal genes involved in vacuolar biogenesis play an evolutionarily conserved role in CG endocytosis.


Conflict of interest statement

Competing Interests: The authors have declared that no competing interests exist.

Figures

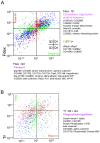
Figure 1
Figure 1. Quantitative profiling of two endocytic routes at single cell resolution.
(A) Experimental workflow outline for cell seeding, transfection and multiplex endocytic assays to obtain multifeature data across 7131 gene depletions. The entire procedure was performed on a cell array (see Figure S1A; details in SOM) and the positions of negative and positive (dsRNA against sec23, arf1, shi) controls are highlighted in their respective colours. (B) Table grouping the 27 quantitative features into categories. The top half of the table contains direct measurements of intensity, while the lower half contains geometric parameters of the cell, endosomes and nucleus. Various measurements are made from each fluorescent channel, including those utilizing different pixel radii for local background subtraction while detecting endosomes. (C) Representative brightfield (bf) and fluorescent micrographs of a field of view of individual cells (zoomed in insets) labeled with four different fluorescent probes: Hoechst; FITC-Dextran (Fdex); Alexa568-Tf (Tf); Alexa647-αOkt9 (Okt9); (see Methods S1 for details). The psuedocolour merge image is a composite of the Fdex (green), TfR (red) and Okt9 (blue) channels. Scale bar = 15 µm; inset = 3×. (D) Grayscale heatmap representing the fraction of four control genes (arf1 (arf79f); shi; sec23; chc) picked up as hits (above a Z-score threshold of 3) across all 27 features in the entire dataset. Higher values on the grayscale bar denote higher pick-up rates. The features with higher pick-up rates correspond to the known endocytic roles of these genes.
Figure 2
Figure 2. A hierarchical organization of endocytic hits.
(A) Maximum parsimony dendogram constructed by binarizing and clustering the perturbation vectors (PV) which show which features each gene is known to perturb. The root node (node 3) is the shared bifurcation point above three main branches – these correspond to genes affecting endocytic pathways, cell size and nuclear morphology PV features. Housekeeping genes such as RNA polymerase and proteasomal subunits populate the stem of the endocytic branch (nodes 4–7) – these affect endocytic processes as a whole. The lower endocytic nodes are further split into CG and CD specific nodes at node 9. (B) Gene Ontology (GO) annotation terms were overlaid onto the tree structure, and GO terms that were present in more than one node were allowed to rise if these nodes were connected. The highest node at which a GO term was found at is shown as a GO ‘Pull-up’ category. For instance, highest node at which the clathrin adaptor complex and clathrin vesicle coat GO terms rise to is node 22, which is the central node specific for CD endocytosis. (C) Grayscale heatmap representing extent of overlaps between all pairs of leaves (colorbar depicts the fraction of overlapping genes) of the leaves prior to (lower diagonal), and post (upper diagonal) tree construction. Most genes which overlapped prior to tree construction have risen to internal nodes. Post the tree construction, significant overlap is seen only between Fclc and Tclc nodes (circled in yellow).
Figure 3
Figure 3. Primary hits validated in a secondary classification assay.
(A–B) Schema (A) and positional patterning (B) on cell arrays of secondary endocytic classification assays carried out for all CG features (upper schema) or a subset of CD features (lower schema).All the test genes were surrounded with local positive controls, and negative controls (see legend in (B)). With this patterning, each gene was tested in triplicate, with three local positive controls and six local negative controls. (C) Heatmap representing raw mean fluorescence intensities (in the pulse channel) across a test cell array used to validate the CG secondary endocytic assay described in (A). Only the means of control wells are shown in the top panel and the inter-control variation in means is representative of a typical experiment. For comparison, the lower panel depicts the mean fluorescence intensities of test genes. (D) The green bars show the fraction of genes predicted as hits for each feature in the primary screen that were also picked up as hits for that feature in the secondary. The gray bars show the fraction of genes not predicted as a hit for each feature in the primary screen that were nevertheless picked up as hits for that feature in the secondary. With a single exception (Tnum) we find that the green bars exceed the gray (p-value 5×10⁻⁶ for 22 fair coin flips) demonstrating the selectivity and reproducibility of our primary assay. (E) Psuedocoloured fluorescence micrographs of representative control and drab5- and dvps4- dsRNA treated populations of cells that were subjected to the CG pulse-chase assay from (A). Both Drab5 and Dvps4 depleted cells were affected in the chase (with Fdex, green) portion of the assay, while the pulse portion (with Rdex, red) was unaffected (see quantitation in bar graphs on the right, normalized to control). Scale bar = 10 µm.
Figure 4
Figure 4. An interpretive summary of classified genes.
(A) Normalized ratios (with respect to local controls) of the fluid-phase pulse intensity vs. chase intensity features for all test genes from the classification assay. See inset axes for quadrant numbering. Quadrant color map:green, genes with only chase features increased or decreased; red, genes with only pulse features increased or decreased; blue, genes with both pulse and chase features increased or decreased; gray, genes that did not significantly perturb these features. A selection of GO categories and genes from quadrants 1 and 3 have been highlighted for the fluid pulse vs chase features; the remaining GO categories and genes populating all quadrants are listed in Table S4. Similar quadrant analyses (not shown) were performed for chase intensity vs. pulse-to-chase ratio (Table S4). Genes involved in lysosomal routing, multivesicular body (MVB) sorting and membrane deformation emerged in quadrant 2 (C−, P/C+). (B) Normalized ratios (with respect to local controls) of the TfR ratio vs fluid intensity features for all test genes from the classification assay. Quadrant color map: red, genes with only fluid features increased or decreased; green, genes with only TfR features increased or decreased; blue, genes with both fluid or TfR features increased or decreased; gray, genes that did not significantly perturb these features. Transport genes collected from quadrants 3 and 4 are highlighted (right), and the rest of the GO categories and genes populating populating all the quadrants are listed in Table S4.
Figure 5
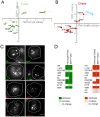
Figure 5. Endocytic phenotypes in mutant primary hemocytes from Drosophila.
(A–D) dsRNA treated S2R+ cells phenocopy corresponding allelic mutants in primary hemocyte cultures in a secondary assay. Scatter plots (A, B) show normalized fold change in fluorescence intensity of dextran that was pulsed (A) or chased (B) in S2R+ cells treated with different dsRNAs (y axis) or in hemocytes (x axis) from the corresponding mutant flies. In all cases, representative values were normalized to those from negative controls (CS hemocytes or zeo dsRNA treated S2R+ cells) and are plotted as mean± SEM. (n>30 for hemocyte assays, n>200 for S2R+ assays in all cases). For the chase assay in (B), we utilized dor4 and car1 mutant hemocytes as positive controls (shown in light blue; Sriram et al., 2003). (C) Representative micrographs of hemocyte cultures from flies carrying hypomorphic alleles of vps35, epac, α-cop and CG1418 assayed as in (B). (D) Summary of the experiment in (A–B) displaying statistically significant (Student's T-test, p<0.05) changes in uptake/retention of mutant hemocytes or gene-depleted S2R+ cells as colour coded maps. Scale bar in (C) = 5 µm.
Figure 6
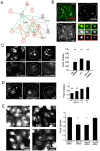
Figure 6. Role of lysosomal genes.
(A) Network map depicting known and predicted interactions (green lines: genetic; blue lines: physical; brown lines: predicted based on conserved data) between the ‘Granule group’ set of eye colour mutants (pink) and selected hits (gray). In this network, genes encoding Carnation (car; the fly homolog of VPS33), Deep orange (dor), Carmine (cm) and Rab7 were identified with roles in CG endocytosis in this study (denoted by black asterisks), while White (w) depletion affected at least one Tf pathway feature (white asterisk). (B) Localization of Carnation on early fluid endosomes. Drosophila S2R+ cells were pulsed with TMR-Dextran for two minutes and fixed and labeled with antibodies to Carnation (αCar). Micrographs show a representative cell imaged in two channels and a pseudo colour merge image (labeled TMRdex and αCar), in red, green and merge respectively). Carnation (green) is seen enriched on peripheral, small, early fluid endosomes (red). Three examples of such endosomes (white arrows in merge panel) are shown in the magnified inset. (C) Fluorescent micrographs depict the levels of fluid uptake in representative S2R+ cells treated with dsRNA against car (first lower panel) or syx1A (last lower panel) or in hemocytes from car1 mutant flies (middle lower panel), with their respective controls (upper panels). Bar graph represents mean and SD of normalized fluorescent integrated intensity per cell from 2–3 experiments, with 100–150 cells per treatment (S2R+ cells) or 40 cells per genotype (hemocytes). (D) Representative fluorescent micrographs depict fluid uptake measured in hemocytes as in (C), in flies that were: homozygous for a mutant allele of car (car1); a hetero-allelic combination of car1/+;syx1/+;or wild type (CS). Also tested were flies heterozygous for syx1/+ and car1/+. Bar graph represents mean and SD of normalized fluorescent integrated intensity per hemocyte from 2–3 experiments with 40 cells per genotype. (E) Representative micrographs show human AGS cells treated with control siRNA or siRNA to hSYX1A and hVPS33A/B and pulsed with FITC-Dextran for 5 min. Right panel - Bar graphs show population averaged mean fluorescence intensity uptake per cell (representative experiment with n>50 cells per replicate, 2 replicates). Scale bar in (B–E) main panel = 5 µm, inset = 1 µm. Double asterisks denote significance p values lower than 0.01 with the Student's T-Test.
Figure 7
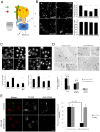
Figure 7. Vacuolar acidification and endocytic regulation.
(A) Cartoon depicting arrangement of components of the V-ATPase complex in Drosophila, identified for their involvement in the CG (green) and CD (red) pathways in the primary screen. (B) Fluorescent images show representative micrographs of S2R+ cells treated with control dsRNA or dsRNA against V-ATPase V1 subunits F (dvma7), B (dvma2) and H (dvma13).Bar graphs on the right shows normalized FITC-Dextran uptake (fluorescent integrated intensity per cell; upper panel) or normalized Tf uptake in the same cells (calculated as amount of internalized Tf normalized to cell surface Tf receptor; lower panel).Values are mean ± SEM from a representative experiment with n>100 cells per replicate, 2 replicates). (C) CHO cells were either untreated (control) or treated with Monensin (Mon; left panels) or Bafilomycin A (right panels) in the presence of Brefeldin A (BFA) or absence, and then assayed for fluid uptake with a pulse of TMR-Dextran (Methods S1).Fluorescent micrographs show representative fields of cells after the corresponding treatments (indicated in white). Bar graphs depict data from a representative experiment showing mean fluorescent integrated intensity per cell for each condition, normalized to untreated controls (mean ± SEM, of 2 replicates, n>50 cells per replicate). Double asterisks denote significance p values lower than 0.01 with the Student's T-Test. Scale bar in (B) = 10 µm, (A) = 20 µm. (D) Untreated control MEFs or those treated with Bafilomycin A were pulsed with HRP for 2 min and then fixed and processed for EM (Methods S1). EM micrographs were counted for the presence of small (40–60 nm) or large (80–120 nm) vesicles (marked by black arrowheads) or the more complex early tubules that correspond to the CG pathway (marked by black arrows). Bar graph shows averaged data from 4–6 cells per experiment across 2 independent experiments, p values are indicated for comparison sets using Student's T-Test. Scale bar = 200 nm; M = mitochondrion; PM = plasma membrane; NUC = nucleus. (E) MEFs were treated with Bafilomycin A and assayed for CD44 and Tf uptake as described , . Fluorescent micrographs show representative fields of cells. Bar graph depicts data from three experiments showing mean fluorescent integrated intensity per cell for each condition, normalized to untreated controls (mean ± SEM, of 3 replicates, 10–12 cells per replicate). p values are indicated for comparison sets using Student's T-Test. Scale bar = 10 µm.
Figure 8
Figure 8. Relationships of hit subsets to Genome wide screens and an interpretive summary of primary hits.
(A) Relationships of hit subsets to other screens. The heat map shows the degree of overlap between hits in different tree categories (rows) with various other RNAi screens (columns). Overlap is quantified as the fraction of genes in a given tree category also identified as a hit by the group of screens. The number of genes in each grouping is denoted in brackets. The screens are grouped as shown in Table S8, first tab. (B) Selected genes from collected nodes (representing the CG pathway (red box), CD pathway (green boxes) and nuclear morphology (light orange box) parameters) are shown overlaid onto the tree hierarchy.

Similar articles

Cited by

References

    1. Mayor S, Pagano RE (2007) Pathways of clathrin-independent endocytosis. Nat Rev Mol Cell Biol 8: 603–612. - PubMed
    1. Doherty GJ, McMahon HT (2009) Mechanisms of endocytosis. Annual review of biochemistry 78: 857–902. - PubMed
    1. Kumari S, Mg S, Mayor S (2010) Endocytosis unplugged: multiple ways to enter the cell. Cell Res 20: 256–275. - PMC - PubMed
    1. Howes MT, Mayor S, Parton RG (2010) Molecules, mechanisms, and cellular roles of clathrin-independent endocytosis. Current opinion in cell biology 22: 519–527. - PubMed
    1. Donaldson JG, Porat-Shliom N, Cohen LA (2009) Clathrin-independent endocytosis: a unique platform for cell signaling and PM remodeling. Cell Signal 21: 1–6. - PMC - PubMed

Publication types

MeSH terms

LinkOut - more resources