. 2014 Jun 26;10(6):e1004230.
doi: 10.1371/journal.ppat.1004230. eCollection 2014 Jun.

A virulent strain of deformed wing virus (DWV) of honeybees (Apis mellifera) prevails after Varroa destructor-mediated, or in vitro, transmission

Affiliations

A virulent strain of deformed wing virus (DWV) of honeybees (Apis mellifera) prevails after Varroa destructor-mediated, or in vitro, transmission

Eugene V Ryabov et al. PLoS Pathog. .

Abstract

The globally distributed ectoparasite Varroa destructor is a vector for viral pathogens of the Western honeybee (Apis mellifera), in particular the Iflavirus Deformed Wing Virus (DWV). In the absence of Varroa low levels DWV occur, generally causing asymptomatic infections. Conversely, Varroa-infested colonies show markedly elevated virus levels, increased overwintering colony losses, with impairment of pupal development and symptomatic workers. To determine whether changes in the virus population were due Varroa amplifying and introducing virulent virus strains and/or suppressing the host immune responses, we exposed Varroa-naïve larvae to oral and Varroa-transmitted DWV. We monitored virus levels and diversity in developing pupae and associated Varroa, the resulting RNAi response and transcriptome changes in the host. Exposed pupae were stratified by Varroa association (presence/absence) and virus levels (low/high) into three groups. Varroa-free pupae all exhibited low levels of a highly diverse DWV population, with those exposed per os (group NV) exhibiting changes in the population composition. Varroa-associated pupae exhibited either low levels of a diverse DWV population (group VL) or high levels of a near-clonal virulent variant of DWV (group VH). These groups and unexposed controls (C) could be also discriminated by principal component analysis of the transcriptome changes observed, which included several genes involved in development and the immune response. All Varroa tested contained a diverse replicating DWV population implying the virulent variant present in group VH, and predominating in RNA-seq analysis of temporally and geographically separate Varroa-infested colonies, was selected upon transmission from Varroa, a conclusion supported by direct injection of pupae in vitro with mixed virus populations. Identification of a virulent variant of DWV, the role of Varroa in its transmission and the resulting host transcriptome changes furthers our understanding of this important viral pathogen of honeybees.


Conflict of interest statement

The authors have declared that no competing interests exist.

Figures

Figure 1
Figure 1. Design of the frame transfer experiment, summary of treatments, and experimental honeybee groups.
Shown are treatments of the experimental groups of honeybees originated in a single colony, number (n) of individuals, and the results of DWV-like virus quantification in the individual pupae by real-time PCR (average Ct value ± standard deviation (SD) and the range of Ct values).
Figure 2
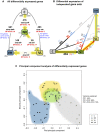
Figure 2. Summary of the gene expression changes in the experiment.
(A) Total number of differentially expressed (DE) genes in the contrasts. The numbers of up-regulated and down-regulated genes in each contrast are marked, respectively, as ↑ and ↓. An up-regulated gene level is higher at the head of the arrow showing the contrast; commonality is shown in brackets. The numbers of overrepresented GO Biological Process terms associated with the DE genes are shown in red italic characters for each contrast. (B) A geometrical visualization of the three-stage experimental process: shown are, with numbers of differentially expressed genes, the “orthogonal” stages, contrasts C to NV (black), NV to VL (red), VL to VH (blue), and the commonalities in the composite stages shown in the colour of the “orthogonal” contrast. The DE gene numbers in the composite contrasts without commonalities to the “orthogonal” stages are shown in grey. Commonalities between orthogonal stages are shown in corresponding colour in brackets. (C) Result of principal component analysis applied to a set 60 DE genes (pooled from all contrasts) with low adjusted p-values. Shown is a plot of the first two principal component scores for Cy3 and Cy5 replicates for all honeybee samples.
Figure 3
Figure 3. High-throughput sequencing of the honeybee small RNA libraries.
The graphs show depth of coverage at the genomic loci of DWV (red) and VDV-1 (blue). A statistical summary of the reads is given to the right of each group. Only reads unambiguously aligning to DWV or VDV-1 were used (GenBank Accession numbers GU109335 and AY251269 respectively) with no mismatches being tolerated in the 18 nt. seed.
Figure 4
Figure 4. Total and strain-specific virus genome quantification in honeybee pupae.
Quantification of the viral RNA by qRT-PCR in the honeybee pupae from the frame transfer experiment. Numbers of the viral RNA molecules per pupa (n = 8 for each experimental group) are shown. (A) Total DWV-like virus load quantified with the primers recognising the NS region of all DWV-like viruses (DWV, VDV-1, recombinants thereof and KV). (B) Quantification of the DWV CP, DWV NS, VDV-1 CP, and VDV-1 NS with the specific primers. Bars show mean value with standard error (SE). Letters above the bars represent statistically significant groupings according to pairwise t-test comparisons, p<0.05; asterisk marks p<0.0001.
Figure 5
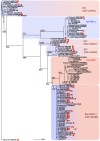
Figure 5. Phylogenetic analysis of the central region of DWV-like virus genome.
PCR amplified cDNA was cloned and sequenced through the region corresponding to positions 4926 to 6255 of the DWV genome (GenBank Accession number AJ489744). The tip labels include GenBank accession numbers and are prefixed as follows: C, NV, VL, VH denote the corresponding honeybee pupae treatment group; Varroa-VH and Varroa-VL indicate sequences from Varroa mites associated with groups VH and VL respectively; “Infested-colony” denotes sequences derived from pupae from the Varroa source colony; DWV, VDV-1, VDV-1-DWV-Rec followed by a place name indicate reference DWV, VDV-1 and VDV-1-DWV recombinant sequences present in GenBank. Sequences derived from the group VH honeybee pupae are highlighted with arrows and sequences from Varroa mites associated with groups VH and VL are indicated with filled or empty squares respectively. Alignments were performed using CLUSTAL , and the neighbour-joining trees were produced and bootstrapped using the PHYLIP package . Numbers at the nodes represent bootstrap values obtained from 1000 replications shown for the major branches supported by more than 750 replications. The length of branches is proportional to the number of changes. RF1 to RF4 indicate the distinct DWV/VDV-1 recombinant forms as defined by similarity to reference DWV and VDV-1 sequences (GenBank Accession numbers GU109335 and AY251269 respectively) in the CP and NS regions of the sequence., DWVV indicates virulent form of DWV.
Figure 6
Figure 6. Changes in the strain composition of DWV complexes in honeybee pupae following direct injection of virus.
Levels of the DWV- and VDV-1 CP-coding RNA determined by qRT-PCR (left panel) in the virus preparations used for injection, and (right panel) in pupae following incubation for 3 days. (A) Left panel: ΔCt values for the DWV-type and VDV-1-type CP were obtained by subtracting Ct values for the corresponding CP from Ct for the total DWV-like viruses quantified using “Universal” primers to the NS gene. Right panel: Ct values for the DWV-type and VDV-1-type CP. Six pupae were used for each virus-injected group, three pupae were used for each of the buffer-injected and non-injected control groups. Bars show mean value with standard error. Letters above the bars represent statistically significant groupings according to pairwise t-test comparisons for VDV-1 CP (p-value <0.01). (B) High-throughput sequencing of the virus preparations from the honeybees of group C (left), and the virus accumulated in the pupae injected with 20 ng of the virus preparation (right), 3 days post injection. The graphs show depth of coverage at genomic loci in DWV (red) and VDV-1 (blue) determined by high-throughput sequencing of viral RNA aligning to the DWV and VDV-1 sequences (GenBank Accession numbers GU109335 and AY251269 respectively). Only reads unambiguously aligning to DWV or VDV-1 sequences were used, with up to 3 mismatches tolerated in the 18 nt. seed region. The percentages of DWV, VDV-1 and the DWV-VDV-1 recombinants predicted by MosaicSolver are shown below. The pileup graphs for DWV and VDV-1 are shown, respectively, in red and dark blue. The CP-coding region of the virus C preparation and the virus C-injected pupae, which shows a decrease of DWV coverage compared to the injected virus, is highlighted in yellow.
Figure 7
Figure 7. DWV diversity and the level of DWV accumulation.
(A) Average Shannon's diversity Index (corrected for NGS sequencing error, as described in Text S1 and (Wood et al., unpublished data) across the NS region, plotted against the proportion of DWV and VDV-1 reads. The error bar associated with each point is a 95% confidence interval for averages produced in this way. (B, C) Shannon's diversity index for all honeybees with low virus levels (groups “Control pupae”, “Buffer-injected pupae” and “Asymptomatic nurse honeybees”) and for the honeybees with high virus levels (groups “Virus-injected pupae” and “Symptomatic nurse honeybees”), (B) for the NS region and (C) for the CP region positions in the DWV reference genome, GenBank Accession number AJ489744, are 5008 to 9826 and 1751 to 4595 respectively. A 95% confidence interval for clonal input RNA library is shown as dashed line at 0.012. The sets of diversity values in (B) and (C) are significantly different, Least Significant Difference (LSD) test at 0.1%.

Similar articles

Cited by

References

    1. Sorrell I, White A, Pedersen AB, Hails RS, Boots M (2009) The evolution of covert, silent infection as a parasite strategy. Proceedings of the Royal Society B-Biological Sciences 276: 2217–2226. - PMC - PubMed
    1. Lambrechts L, Scott TW (2009) Mode of transmission and the evolution of arbovirus virulence in mosquito vectors. Proceedings of the Royal Society B-Biological Sciences 276: 1369–1378. - PMC - PubMed
    1. Weiss RA (2002) Virulence and pathogenesis. Trends in Microbiology 10: 314–317. - PubMed
    1. Boots M, Greenman J, Ross D, Norman R, Hails R, et al. (2003) The population dynamical implications of covert infections in host-microparasite interactions. Journal of Animal Ecology 72: 1064–1072.
    1. Rigaud T, Perrot-Minnot M-J, Brown MJF (2010) Parasite and host assemblages: embracing the reality will improve our knowledge of parasite transmission and virulence. Proceedings of the Royal Society B-Biological Sciences 277: 3693–3702. - PMC - PubMed

Publication types

MeSH terms

Substances