. 2014 Aug 1;289(31):21544-61.
doi: 10.1074/jbc.M114.558890. Epub 2014 Jun 17.

Role of activating transcription factor 3 (ATF3) in endoplasmic reticulum (ER) stress-induced sensitization of p53-deficient human colon cancer cells to tumor necrosis factor (TNF)-related apoptosis-inducing ligand (TRAIL)-mediated apoptosis through up-regulation of death receptor 5 (DR5) by zerumbone and celecoxib

Affiliations

Role of activating transcription factor 3 (ATF3) in endoplasmic reticulum (ER) stress-induced sensitization of p53-deficient human colon cancer cells to tumor necrosis factor (TNF)-related apoptosis-inducing ligand (TRAIL)-mediated apoptosis through up-regulation of death receptor 5 (DR5) by zerumbone and celecoxib

Makoto Edagawa et al. J Biol Chem. .

Abstract

Death receptor 5 (DR5) is a death domain-containing transmembrane receptor that triggers cell death upon binding to its ligand, TNF-related apoptosis-inducing ligand (TRAIL), and a combination of TRAIL and agents that increase the expression of DR5 is expected to be a novel anticancer therapy. In this report, we demonstrate that the stress response gene ATF3 is required for endoplasmic reticulum stress-mediated DR5 induction upon zerumbone (ZER) and celecoxib (CCB) in human p53-deficient colorectal cancer cells. Both agents activated PERK-eIF2α kinases and induced the expression of activating transcription factor 4 (ATF4)-CCAAT enhancer-binding protein (C/EBP) homologous protein, which were remarkably suppressed by reactive oxygen species scavengers. In the absence of ATF3, the induction of DR5 mRNA and protein was abrogated significantly, and this was associated with reduced cell death by cotreatment of TRAIL with ZER or CCB. By contrast, exogenous expression of ATF3 caused a more rapid and elevated expression of DR5, resulting in enhanced sensitivity to apoptotic cell death by TRAIL/ZER or TRAIL/CCB. A reporter assay demonstrated that at least two ATF/cAMP response element motifs as well as C/EBP homologous protein motif at the proximal region of the human DR5 gene promoter were required for ZER-induced DR5 gene transcription. Taken together, our results provide novel insights into the role of ATF3 as an essential transcription factor for p53-independent DR5 induction upon both ZER and CCB treatment, and this may be a useful biomarker for TRAIL-based anticancer therapy.

Keywords: ATF3; Apoptosis; Cancer Therapy; Colon Cancer; DR5; ER Stress; Gene Regulation; Reactive Oxygen Species (ROS); p53-independent.


Figures

FIGURE 1.
FIGURE 1.
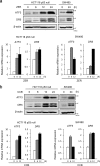
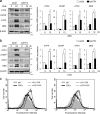
ZER and CCB induce the expression of DR5 and ATF3 in p53-deficient human colorectal cancer cells. a, HCT116-p53null cells or SW480 cells were treated with 20 μm ZER for the indicated times, and their whole cell extracts were assayed for DR5 and ATF3 proteins by Western blotting (top panel). β-actin was used as a loading control. The expression of ATF3 and DR5 mRNAs was also analyzed by qRT-PCR and normalized to the level of GAPDH (bottom panel). b, HCT116-p53null cells or SW480 cells were treated with 50 μm CCB, and the expression of DR5 and ATF3 was analyzed for both mRNA and protein as in a.
FIGURE 2.
FIGURE 2.
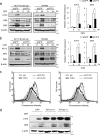
ATF3 is required for DR5 induction by ZER or CCB in p53-deficient cells. a, ATF3 was knocked down in HCT116-p53null cells or SW480 cells, and both cells were treated with 20 μm ZER for the indicated times. DR4, DR5, and ATF3 proteins were analyzed by Western blotting. β-actin was used as a loading control (left panel). The expression of ATF3 and DR5 mRNAs in HCT116-p53null cells was also analyzed by qRT-PCR and normalized to the level of GAPDH (right panel). b, ATF3 knockdown cells were treated with 50 μm CCB, and the expression of DR4, DR5 and ATF3 was assayed as in a. c, cell surface expression of DR5 was measured by flow cytometry. ATF3 knockdown HCT116-p53null cells or siGFP HCT116-p53null cells were treated with ZER (left panel) or CCB (right panel) for 24 h as under “Experimental Procedures.” Shaded no line, vehicle with control IgG; thick line, vehicle with anti-DR5 antibody; thin line, ZER or CCB of siGFP cells with anti-DR5 antibody; dashed line, ZER or CCB of siATF3 cells with anti-DR5 antibody. d, HCT116-p53null cells stably expressing FLAG-ATF3 or GFP were treated with 20 μm ZER for 24 h, and their whole cell extracts were analyzed for DR5 and ATF3 proteins by Western blotting using β-actin as a loading control. *, p < 0.05; **, p < 0.01.
FIGURE 3.
FIGURE 3.
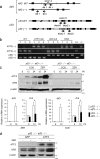
Generation of Atf3/p53 knockout mice and the loss of Atf3 impairs DR5 induction by ZER or CBB in p53 null MEFs. a, schematic of the generation of Atf3 and p53 knockout mice. The positions of the primers for the genomic PCR are indicated. b, genomic DNA from newborn mice was extracted and subjected to PCR using the primer sets listed under “Experimental Procedures.” PCR products were analyzed with 2% agarose gel electrophoresis. C, Atf3+/+p53−/− or DKO MEFs were treated with 50 μm CCB or 20 μm ZER for the indicated times, and the expression of DR5 and ATF3 was analyzed by Western blotting (top panel) and qRT-PCR (bottom panel), respectively. d, ATF3 was stably expressed by reintroduction into DKO MEFs, and these cells were treated with ZER. The expression of ATF3 and DR5 proteins was measured by Western blotting using β-actin as a loading control. *, p < 0.05.
FIGURE 4.
FIGURE 4.
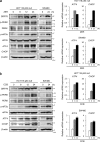
The UPR is activated by ZER and CCB, and ROS scavengers inhibit it activation and cell surface expression of DR5. HCT116-p53null cells or SW480 cells were treated with 20 μm ZER (a) or 50 μm CCB (b) for the indicated times, and the expression of GRP78, PERK, eIF2α, ATF4, and CHOP proteins was examined by Western blotting. β-actin was used as a loading control (left panel). ATF4 and CHOP mRNAs were also measured by qRT-PCR and normalized to GAPDH (right panel). c, HCT116-p53null cells were incubated with the indicated concentrations of NAC (left panel) or GSH (right panel) for 1 h, followed by ZER or CCB treatment. Cell extracts were assayed as in a. d, cell surface expression of DR5 of NAC-treated HCT116-p53null cells was measured following treatment with 20 μm ZER (left panel) or 50 μm CCB (right panel) for 24 h as under “Experimental Procedures.” Shaded no line, vehicle with control IgG; thick line, vehicle with anti-DR5 antibody; thin line, ZER or CCB of control cells with anti-DR5 antibody; dashed line, ZER or CCB of NAC-treated cells with anti-DR5 antibody. e, after treatment with the indicated concentrations of ZER (left panel) or CCB (right panel) for 24 h, HCT116-p53null cells were labeled with 2′,7′-dichlorodihydrofluorescein diacetate, and intracellular ROS levels were measured by flow cytometry. f, HCT116-p53null cells were incubated with 0.2 mm H2O2 for 30 min, and then cells were collected at the indicated time points and assayed as in a.
FIGURE 4.
FIGURE 4.
The UPR is activated by ZER and CCB, and ROS scavengers inhibit it activation and cell surface expression of DR5. HCT116-p53null cells or SW480 cells were treated with 20 μm ZER (a) or 50 μm CCB (b) for the indicated times, and the expression of GRP78, PERK, eIF2α, ATF4, and CHOP proteins was examined by Western blotting. β-actin was used as a loading control (left panel). ATF4 and CHOP mRNAs were also measured by qRT-PCR and normalized to GAPDH (right panel). c, HCT116-p53null cells were incubated with the indicated concentrations of NAC (left panel) or GSH (right panel) for 1 h, followed by ZER or CCB treatment. Cell extracts were assayed as in a. d, cell surface expression of DR5 of NAC-treated HCT116-p53null cells was measured following treatment with 20 μm ZER (left panel) or 50 μm CCB (right panel) for 24 h as under “Experimental Procedures.” Shaded no line, vehicle with control IgG; thick line, vehicle with anti-DR5 antibody; thin line, ZER or CCB of control cells with anti-DR5 antibody; dashed line, ZER or CCB of NAC-treated cells with anti-DR5 antibody. e, after treatment with the indicated concentrations of ZER (left panel) or CCB (right panel) for 24 h, HCT116-p53null cells were labeled with 2′,7′-dichlorodihydrofluorescein diacetate, and intracellular ROS levels were measured by flow cytometry. f, HCT116-p53null cells were incubated with 0.2 mm H2O2 for 30 min, and then cells were collected at the indicated time points and assayed as in a.
FIGURE 5.
FIGURE 5.
ATF4 knockdown suppresses ZER- or CCB-induced expression of CHOP, ATF3, and DR5. ATF4 was knocked down in HCT116-p53null cells, and these cells were treated with 40 mm ZER (a) or 50 mm CCB (b) for 24 h. Expression of ATF4, CHOP, ATF3, and DR5 was measured by Western blotting (left panel) and qRT-PCR (right panel), respectively. siCtrl, control siRNA. c, cell surface expression of DR5 of control or siATF4 cells was measured after ZER (left panel) or CCB (right panel) treatment as under “Experimental Procedures.” Shaded no line, vehicle with control IgG; thick line, vehicle with anti-DR5 antibody; thin line, ZER or CCB of control cells with anti-DR5 antibody; dashed line, ZER or CCB of siATF4 cells with anti-DR5 antibody. *, p < 0.05; **, p < 0.01.
FIGURE 6.
FIGURE 6.
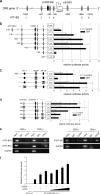
ATF3 and CHOP are required for ZER-induced activation of the DR5 gene promoter. a, schematic of the human DR5 gene promoter region. Six ATF/CREB binding sites (ATF-BS1 through ATF-BS6) and binding sites for CHOP (CHOP-BS) and p53 (p53-BS) are depicted. b, HCT116-p53null cells were treated with ZER for 12 h, and a ChIP assay was carried out using anti-ATF3 or anti-CHOP antibodies as under “Experimental Procedures.” Luc, luciferase. c, each of the 5′ deletion mutants of the human DR5 gene reporter plasmid was transfected into HCT116-p53null cells. 24 h post-transfection, cells were treated with 20 μm ZER for 12 h, and luciferase activity was measured. Relative luciferase activity represents the fold induction compared with that of non-stimulated cells transfected with pDR5-Luc(-2.5k). d, cells were transfected with pDR5-Luc(-552) reporters harboring mutations at binding sites for CHOP, NF-κB, or Elk1 and treated as in c. Relative luciferase activity represents the fold induction compared with that of untreated pDR5-Luc(-552). e, cells were transfected with pDR5-Luc(-448) containing mutations at ATF-BS2, ATF-BS3, or ATF-BS4 and treated with ZER as in c. Relative luciferase activity represents the fold induction compared with that of untreated pDR5-Luc(-448). f, cells were cotransfected with pDR5-Luc(-552) and each of the expression plasmids for ATF3 or CHOP. Relative luciferase activity represents the fold induction compared with that of cells transfected with empty vector. Data are mean ± S.E. of three independent experiments.
FIGURE 7.
FIGURE 7.
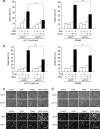
ATF3 promotes the ZER or CCB/TRAIL-induced apoptosis of p53-deficient colorectal cancer cells. a, ATF3 was knocked down in HCT116-p53null cells (left panel) or SW480 cells (right panel), and cells were treated with 30 μm ZER and/or 2.5 ng/ml TRAIL for 24 h. Cell death was measured using a trypan blue exclusion assay. The proportions of dead cells from three independent experiments are shown. b, ATF3 knockdown cells were treated with 75 μm CCB and/or 2.5 ng/ml TRAIL for 24 h. Cell death was measured as in a. HCT116-p53null cells were treated with 20 μm ZER (c) or 50 μm CCB (d) and/or 2.5 ng/ml TRAIL for 24 h. The cells were examined by phase-contrast microscopy (top panel) or fluorescence microscope after staining with DAPI (bottom panel). Arrowheads indicate cells with condensation or fragmentation of nuclei. Scale bars = 50 μm. e, whole cell extracts were prepared from cells treated as in a and analyzed by Western blotting for cleaved caspase 3, cleaved PARP, ATF3, and DR5 proteins. β-actin was used as a loading control. f, HCT116-p53null cells (left panel) or SW480 cells (right panel) stably expressing FLAG-ATF3 or GFP were treated with 30 μm ZER and/or 2.5 ng/ml TRAIL for 24 h, followed by a trypan blue exclusion assay as in a. g, ATF3 overexpressed cells as in f were treated with 75 μm CCB and/or 2.5 ng/ml TRAIL for 24 h, followed by a trypan blue exclusion assay as in a. Data are mean ± S.E. of three independent experiments. *, p < 0.05; **, p < 0.01.
FIGURE 7.
FIGURE 7.
ATF3 promotes the ZER or CCB/TRAIL-induced apoptosis of p53-deficient colorectal cancer cells. a, ATF3 was knocked down in HCT116-p53null cells (left panel) or SW480 cells (right panel), and cells were treated with 30 μm ZER and/or 2.5 ng/ml TRAIL for 24 h. Cell death was measured using a trypan blue exclusion assay. The proportions of dead cells from three independent experiments are shown. b, ATF3 knockdown cells were treated with 75 μm CCB and/or 2.5 ng/ml TRAIL for 24 h. Cell death was measured as in a. HCT116-p53null cells were treated with 20 μm ZER (c) or 50 μm CCB (d) and/or 2.5 ng/ml TRAIL for 24 h. The cells were examined by phase-contrast microscopy (top panel) or fluorescence microscope after staining with DAPI (bottom panel). Arrowheads indicate cells with condensation or fragmentation of nuclei. Scale bars = 50 μm. e, whole cell extracts were prepared from cells treated as in a and analyzed by Western blotting for cleaved caspase 3, cleaved PARP, ATF3, and DR5 proteins. β-actin was used as a loading control. f, HCT116-p53null cells (left panel) or SW480 cells (right panel) stably expressing FLAG-ATF3 or GFP were treated with 30 μm ZER and/or 2.5 ng/ml TRAIL for 24 h, followed by a trypan blue exclusion assay as in a. g, ATF3 overexpressed cells as in f were treated with 75 μm CCB and/or 2.5 ng/ml TRAIL for 24 h, followed by a trypan blue exclusion assay as in a. Data are mean ± S.E. of three independent experiments. *, p < 0.05; **, p < 0.01.
FIGURE 8.
FIGURE 8.
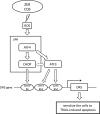
Proposed mechanism of ATF3 in the p53-independent induction of DR5 gene expression by ZER or CCB. In cells with p53 mutation, ZER or CCB provokes ER stress via generation of ROS and activates the PERK-eIF2α branch of the UPR, followed by the cascaded transcriptional program of ATF4/CHOP/ATF3. ATF3 and CHOP cooperatively transactivate DR5 gene transcription through their recruitment onto ATF3-BS3/4 and CHOP-BS of the promoter. The dashed line with the arrow between ATF3 and CHOP represents no mutual negative regulation, as mentioned under “Discussion.” The enhanced expression of DR5 on the cell surface sensitizes colon cancer cells to TRAIL-induced apoptosis. BS, binding site.

Similar articles

Cited by

References

    1. Hanahan D., Weinberg R. A. (2011) The hallmarks of cancer: the next generation. Cell 144, 646–674 - PubMed
    1. Farczádi E., Szántó J., Kaszás I., Benyó I., Bodnár Z., Szlobodnyik J., Szende B. (1999) Changes in apoptotic and mitotic activity in rectal carcinoma after short-term cytostatic therapy as possible predictive factors. Neoplasma 46, 219–223 - PubMed
    1. Scott N., Hale A., Deakin M., Hand P., Adab F. A., Hall C., Williams G. T., Elder J. B. (1998) A histopathological assessment of the response of rectal adenocarcinoma to combination chemo-radiotherapy: relationship to apoptotic activity, p53 and bcl-2 expression. Eur. J. Surg. Oncol. 24, 169–173 - PubMed
    1. Pan G., Ni J., Wei Y. F., Yu G., Gentz R., Dixit V. M. (1997) An antagonist decoy receptor and a death domain-containing receptor for TRAIL. Science 277, 815–818 - PubMed
    1. Walczak H., Degli-Esposti M. A., Johnson R. S., Smolak P. J., Waugh J. Y., Boiani N., Timour M. S., Gerhart M. J., Schooley K. A., Smith C. A., Goodwin R. G., Rauch C. T. (1997) TRAIL-R2: a novel apoptosis-mediating receptor for TRAIL. EMBO J. 16, 5386–5397 - PMC - PubMed

Publication types

MeSH terms