An electrically tight in vitro blood-brain barrier model displays net brain-to-blood efflux of substrates for the ABC transporters, P-gp, Bcrp and Mrp-1
- PMID: 24934296
- PMCID: PMC4147044
- DOI: 10.1208/s12248-014-9628-1
An electrically tight in vitro blood-brain barrier model displays net brain-to-blood efflux of substrates for the ABC transporters, P-gp, Bcrp and Mrp-1
Abstract
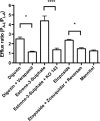
Efflux transporters of the ATP-binding cassette superfamily including breast cancer resistance protein (Bcrp/Abcg2), P-glycoprotein (P-gp/Abcb1) and multidrug resistance-associated proteins (Mrp's/Abcc's) are expressed in the blood-brain barrier (BBB). The aim of this study was to investigate if a bovine endothelial/rat astrocyte in vitro BBB co-culture model displayed polarized transport of known efflux transporter substrates. The co-culture model displayed low mannitol permeabilities of 0.95 ± 0.1 · 10(-6) cm·s(-1) and high transendothelial electrical resistances of 1,177 ± 101 Ω·cm(2). Bidirectional transport studies with (3)H-digoxin, (3)H-estrone-3-sulphate and (3)H-etoposide revealed polarized transport favouring the brain-to-blood direction for all substrates. Steady state efflux ratios of 2.5 ± 0.2 for digoxin, 4.4 ± 0.5 for estrone-3-sulphate and 2.4 ± 0.1 for etoposide were observed. These were reduced to 1.1 ± 0.08, 1.4 ± 0.2 and 1.5 ± 0.1, by addition of verapamil (digoxin), Ko143 (estrone-3-sulphate) or zosuquidar + reversan (etoposide), respectively. Brain-to-blood permeability of all substrates was investigated in the presence of the efflux transporter inhibitors verapamil, Ko143, zosuquidar, reversan and MK 571 alone or in combinations. Digoxin was mainly transported via P-gp, estrone-3-sulphate via Bcrp and Mrp's and etoposide via P-gp and Mrp's. The expression of P-gp, Bcrp and Mrp-1 was confirmed using immunocytochemistry. The findings indicate that P-gp, Bcrp and at least one isoform of Mrp are functionally expressed in our bovine/rat co-culture model and that the model is suitable for investigations of small molecule transport.
Figures


Similar articles
-
Evaluation of drug efflux transporter liabilities of darifenacin in cell culture models of the blood-brain and blood-ocular barriers.Neurourol Urodyn. 2011 Nov;30(8):1633-8. doi: 10.1002/nau.21110. Epub 2011 Aug 8. Neurourol Urodyn. 2011. PMID: 21826715
-
Dexamethasone increases expression and activity of multidrug resistance transporters at the rat blood-brain barrier.Am J Physiol Cell Physiol. 2008 Aug;295(2):C440-50. doi: 10.1152/ajpcell.00491.2007. Epub 2008 Jun 4. Am J Physiol Cell Physiol. 2008. PMID: 18524938 Free PMC article.
-
(18)F-FCWAY, a serotonin 1A receptor radioligand, is a substrate for efflux transport at the human blood-brain barrier.Neuroimage. 2016 Sep;138:134-140. doi: 10.1016/j.neuroimage.2016.05.045. Epub 2016 May 19. Neuroimage. 2016. PMID: 27211474 Free PMC article.
-
Expression and function of multidrug resistance transporters at the blood-brain barriers.Expert Opin Drug Metab Toxicol. 2005 Aug;1(2):233-46. doi: 10.1517/17425255.1.2.233. Expert Opin Drug Metab Toxicol. 2005. PMID: 16922639 Review.
-
Drug transport across the blood-brain barrier and the impact of breast cancer resistance protein (ABCG2).Curr Top Med Chem. 2009;9(2):130-47. doi: 10.2174/156802609787521580. Curr Top Med Chem. 2009. PMID: 19200001 Review.
Cited by
-
Modeling blood-brain barrier pathology in cerebrovascular disease in vitro: current and future paradigms.Fluids Barriers CNS. 2020 Jul 16;17(1):44. doi: 10.1186/s12987-020-00202-7. Fluids Barriers CNS. 2020. PMID: 32677965 Free PMC article. Review.
-
Investigating Maternal Brain Alterations in Preeclampsia: the Need for a Multidisciplinary Effort.Curr Hypertens Rep. 2019 Aug 2;21(9):72. doi: 10.1007/s11906-019-0977-0. Curr Hypertens Rep. 2019. PMID: 31375930 Review.
-
Role of interleukin-6 and interleukin-10 in morphological and functional changes of the blood-brain barrier in hypertriglyceridemia.Fluids Barriers CNS. 2023 Mar 7;20(1):15. doi: 10.1186/s12987-023-00418-3. Fluids Barriers CNS. 2023. PMID: 36882782 Free PMC article.
-
In vitro models of the blood-brain barrier: An overview of commonly used brain endothelial cell culture models and guidelines for their use.J Cereb Blood Flow Metab. 2016 May;36(5):862-90. doi: 10.1177/0271678X16630991. Epub 2016 Feb 11. J Cereb Blood Flow Metab. 2016. PMID: 26868179 Free PMC article. Review.
-
GM1 Oligosaccharide Crosses the Human Blood-Brain Barrier In Vitro by a Paracellular Route.Int J Mol Sci. 2020 Apr 19;21(8):2858. doi: 10.3390/ijms21082858. Int J Mol Sci. 2020. PMID: 32325905 Free PMC article.
References
MeSH terms
Substances
LinkOut - more resources
Full Text Sources
Other Literature Sources
Miscellaneous

