Stoichiometry of site-specific lysine acetylation in an entire proteome
- PMID: 24917678
- PMCID: PMC4118097
- DOI: 10.1074/jbc.M114.581843
Stoichiometry of site-specific lysine acetylation in an entire proteome
Abstract
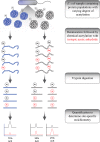
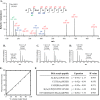
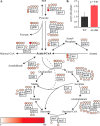
Acetylation of lysine ϵ-amino groups influences many cellular processes and has been mapped to thousands of sites across many organisms. Stoichiometric information of acetylation is essential to accurately interpret biological significance. Here, we developed and employed a novel method for directly quantifying stoichiometry of site-specific acetylation in the entire proteome of Escherichia coli. By coupling isotopic labeling and a novel pairing algorithm, our approach performs an in silico enrichment of acetyl peptides, circumventing the need for immunoenrichment. We investigated the function of the sole NAD(+)-dependent protein deacetylase, CobB, on both site-specific and global acetylation. We quantified 2206 peptides from 899 proteins and observed a wide distribution of acetyl stoichiometry, ranging from less than 1% up to 98%. Bioinformatic analysis revealed that metabolic enzymes, which either utilize or generate acetyl-CoA, and proteins involved in transcriptional and translational processes displayed the highest degree of acetylation. Loss of CobB led to increased global acetylation at low stoichiometry sites and induced site-specific changes at high stoichiometry sites, and biochemical analysis revealed altered acetyl-CoA metabolism. Thus, this study demonstrates that sirtuin deacetylase deficiency leads to both site-specific and global changes in protein acetylation stoichiometry, affecting central metabolism.
Keywords: Acetyl-CoA Synthetase; Acetylation; Escherichia coli (E. coli); Mass Spectrometry (MS); Metabolism; Proteomics; Stoichiometry.
© 2014 by The American Society for Biochemistry and Molecular Biology, Inc.
Figures


Similar articles
-
Accurate Quantification of Site-specific Acetylation Stoichiometry Reveals the Impact of Sirtuin Deacetylase CobB on the E. coli Acetylome.Mol Cell Proteomics. 2017 May;16(5):759-769. doi: 10.1074/mcp.M117.067587. Epub 2017 Mar 2. Mol Cell Proteomics. 2017. PMID: 28254776 Free PMC article.
-
Proteome-wide lysine acetylation profiling of the human pathogen Mycobacterium tuberculosis.Int J Biochem Cell Biol. 2015 Feb;59:193-202. doi: 10.1016/j.biocel.2014.11.010. Epub 2014 Nov 29. Int J Biochem Cell Biol. 2015. PMID: 25456444
-
Site-Specific Quantification of Lysine Acetylation Using Isotopic Labeling.Methods Enzymol. 2017;586:85-95. doi: 10.1016/bs.mie.2016.09.029. Methods Enzymol. 2017. PMID: 28137578
-
Bacterial protein acetylation: mechanisms, functions, and methods for study.Front Cell Infect Microbiol. 2024 Jul 4;14:1408947. doi: 10.3389/fcimb.2024.1408947. eCollection 2024. Front Cell Infect Microbiol. 2024. PMID: 39027134 Free PMC article. Review.
-
The Escherichia coli proteome: past, present, and future prospects.Microbiol Mol Biol Rev. 2006 Jun;70(2):362-439. doi: 10.1128/MMBR.00036-05. Microbiol Mol Biol Rev. 2006. PMID: 16760308 Free PMC article. Review.
Cited by
-
Acetyl-CoA and the regulation of metabolism: mechanisms and consequences.Curr Opin Cell Biol. 2015 Apr;33:125-31. doi: 10.1016/j.ceb.2015.02.003. Epub 2015 Feb 20. Curr Opin Cell Biol. 2015. PMID: 25703630 Free PMC article. Review.
-
Distinct Cellular Assembly Stoichiometry of Polycomb Complexes on Chromatin Revealed by Single-molecule Chromatin Immunoprecipitation Imaging.J Biol Chem. 2015 Nov 20;290(47):28038-28054. doi: 10.1074/jbc.M115.671115. Epub 2015 Sep 17. J Biol Chem. 2015. PMID: 26381410 Free PMC article.
-
Regulation of urea cycle by reversible high-stoichiometry lysine succinylation.Nat Metab. 2024 Mar;6(3):550-566. doi: 10.1038/s42255-024-01005-y. Epub 2024 Mar 6. Nat Metab. 2024. PMID: 38448615
-
Dimer interface of bovine cytochrome c oxidase is influenced by local posttranslational modifications and lipid binding.Proc Natl Acad Sci U S A. 2016 Jul 19;113(29):8230-5. doi: 10.1073/pnas.1600354113. Epub 2016 Jun 30. Proc Natl Acad Sci U S A. 2016. PMID: 27364008 Free PMC article.
-
Defining the orphan functions of lysine acetyltransferases.ACS Chem Biol. 2015 Jan 16;10(1):85-94. doi: 10.1021/cb500853p. ACS Chem Biol. 2015. PMID: 25591746 Free PMC article. Review.
References
-
- Tanner K. G., Trievel R. C., Kuo M. H., Howard R. M., Berger S. L., Allis C. D., Marmorstein R., Denu J. M. (1999) Catalytic mechanism and function of invariant glutamic acid 173 from the histone acetyltransferase GCN5 transcriptional coactivator. J. Biol. Chem. 274, 18157–18160 - PubMed
-
- Weinert B. T., Iesmantavicius V., Wagner S. A., Schölz C., Gummesson B., Beli P., Nyström T., Choudhary C. (2013) Acetyl phosphate is a critical determinant of lysine acetylation in E. coli. Mol. Cell 51, 265–272 - PubMed
Publication types
MeSH terms
Substances
Grants and funding
LinkOut - more resources
Full Text Sources
Other Literature Sources
Molecular Biology Databases

