. 2014 Jun 6;4(8):1479-89.
doi: 10.1534/g3.114.012435.

Interplay of interlocus gene conversion and crossover in segmental duplications under a neutral scenario

Affiliations

Interplay of interlocus gene conversion and crossover in segmental duplications under a neutral scenario

Diego A Hartasánchez et al. G3 (Bethesda). .

Abstract

Interlocus gene conversion is a major evolutionary force that drives the concerted evolution of duplicated genomic regions. Theoretical models successfully have addressed the effects of interlocus gene conversion and the importance of crossover in the evolutionary fate of gene families and duplications but have not considered complex recombination scenarios, such as the presence of hotspots. To study the interplay between interlocus gene conversion and crossover, we have developed a forward-time simulator that allows the exploration of a wide range of interlocus gene conversion rates under different crossover models. Using it, we have analyzed patterns of nucleotide variation and linkage disequilibrium within and between duplicate regions, focusing on a neutral scenario with constant population size and validating our results with the existing theoretical models. We show that the interaction of gene conversion and crossover is nontrivial and that the location of crossover junctions is a fundamental determinant of levels of variation and linkage disequilibrium in duplicated regions. We also show that if crossover activity between duplications is strong enough, recurrent interlocus gene conversion events can break linkage disequilibrium within duplicates. Given the complex nature of interlocus gene conversion and crossover, we provide a framework to explore their interplay to help increase knowledge on molecular evolution within segmental duplications under more complex scenarios, such as demographic changes or natural selection.

Keywords: concerted evolution; forward simulations; increased variation; linkage disequilibrium; recombination hotspots.


Figures

Figure 1
Figure 1
The three phases of every simulation run. Each simulation begins with a burn-in phase, in which a population formed by chromosomes with two single-copy blocks (dark blue and orange) is brought to mutation-drift equilibrium. The duplication of the first of these blocks (original block: dark blue, duplicated block: light blue) marks the initiation of the structured phase, during which the duplication becomes fixed. Finally, during the concerted evolution phase, the population reaches a new equilibrium in which the interplay of interlocus gene conversion between duplicated blocks and crossover determines levels and patterns of variability.
Figure 2
Figure 2
Variation measures. We measure nucleotide variation among segmental duplications as follows: (w) variation within duplicate blocks (at equilibrium, variation within the original and duplicated blocks will be the same); (b) variation between the original and duplicated blocks on different chromosomes; (s) variation between the original and duplicated blocks on the same chromosome. We use average pairwise differences (π) to measure all these types of variation (πw, πb, πs).
Figure 3
Figure 3
Changes in variation within blocks along simulations. Average results from 10,000 simulation runs are shown. (A) Dark blue, orange, and light blue curves correspond to the average pairwise differences found within the original, single-copy, and duplicated blocks, respectively. Gray-shaded areas correspond to the burn-in phase, structured phase, and concerted evolution phase. Duplication occurs at t = 30N. Although we depict the structured phase as ending at t = 50N, this is actually an arbitrary upper limit, because the neutral trajectory of the duplicated chromosomes and length of the structured phase is different every simulation. As expected, variation at equilibrium for the single-copy block is Θ = θL = 4NμL. The original and duplicated blocks attain higher variation (~1.95Θ) due to IGC activity among them. Parameters for this simulation are N = 1000, k = 1000, L = 5000, θ = 0.001, C = 0.5, R = 50, and λ = 100. (B) Distributions of πwsim for the original (top) and duplicated (bottom) blocks at different times after the appearance of the duplication (t = 31N, 32N, 34N, 38N, 50N, and 120N) are colored in different shades of green.
Figure 4
Figure 4
LD patterns under different crossover models. Average values for 1000 simulations are shown. LD between each pair of windows along the sequence (D′) is coded with a number between 0 and 1 and represented with a color (from white to dark blue to light green). Three different IGC rates (0, 1, and 50) are represented in columns and three different crossover conditions are shown in rows: no crossover, SCC (R = 50), and WRC (R = 50). The red lines below the names identifying each block show regions undergoing crossover. In the first row, where no crossover is acting, a dark blue diagonal line appears when IGC is active (and increasing with IGC rate) representing LD between paralogous windows of duplicate blocks. LD within the duplicate region is high when no IGC is acting and when IGC is high (C = 50) but decreases with a medium IGC rate. LD between duplicates (dark blue diagonal line) decreases when crossover is active on the single-copy region (SCC model, row 2) and on the whole region (WRC model, row 3) with respect to R = 0. As expected, crossover breaks LD blocks in the regions where it is acting. IGC also breaks LD blocks within duplicates if crossover is active (both in the SCC model and in the WRC model).
Figure 5
Figure 5
Comparison between data from simulations under the SCC model and the WRC model. Results are shown for (A) πwC, (B) πsA, and (C) E(Dsum). Continuous lines are based on the SCC model and are shown for different crossover rates (R = 10, 50, and 100). As expected, results from SCC simulations are in very good agreement with theoretical expectations. Results from WRC simulations agree with theoretical expectations (discontinuous lines) for R’ = (2/3)R, showing that allowing crossover to occur in the duplicate regions has an effect identical to that of effectively reducing the crossover rate by one third on the SCC model. Although we have not implemented any IGC rate dependence on sequence similarity between duplicates, according to Walsh (1987) IGC rates C > 0.2 would ensure the prevalence of stable concerted evolution at least temporarily in the face of genetic drift (see File S1). The shaded area indicates the region that lies beyond this threshold, where both theoretical predictions and results from our simulations might not be biologically realistic.
Figure 6
Figure 6
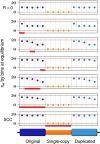
Variation within a duplicate block under different crossover conditions. The plot shows variation within duplicates under the HSC model. Each point corresponds to the average equilibrium value over 1000 simulation runs. Columns indicate different hotspot locations on the original block (illustrated by the red lines in the diagram). Expected values (πwC) for R = 0 and for the SCC model (R = 10) are shown to the left and to the right of the plot respectively. Regardless of the width and localization of the hotspot, variation within duplicates is decreased in comparison with the SCC model but increased with respect to R = 0. Hotspots located the furthest away from the duplicated block (to the left) have the strongest effect in lowering the amount of variation, while those localized closest to the duplicated block still lower the variation but to a lesser degree (to the right). Hotspots centered in the original block have an intermediate effect.
Figure 7
Figure 7
Distribution of variation along the sequence under different crossover conditions. Comparison between variation along the sequence when R = 0 (top row) and when crossover occurs (R = 10) on different conditions. Red rectangles indicate the regions undergoing crossover. In the bottom, variation along the sequence on SCC model is shown. Plots in the middle show different HSC model cases (different locations and lengths of the crossover hotspot region). Circles correspond to average pairwise differences calculated by bins within the original, single-copy and duplicated blocks, respectively. Each block is divided into five bins. Bins to the left of the hotspot have an amount of variation similar to that found under the SCC model whereas those to the right have a variation level equivalent to that of a model with no crossover (R = 0). Bins within the hotspot have intermediate levels of variation, which are lower for bins that are closer to the single-copy region. Additionally, original and duplicated blocks have identical (non-symmetrical) patterns of variation within them. This figure is for C = 0.5. Equivalent results are attained for greater values of C.
Figure 8
Figure 8
Comparison of LD between scenarios with one or two crossover hotspots. Average values for 1000 simulations are shown. LD between each pair of windows along the sequence (D′) is coded with a number between 0 and 1 and represented with a color (from white to dark blue to light green). Three different IGC rates (0, 1, and 50) are represented in columns. Rows show the effect of crossover (R = 50) located in one specific region of the original block or in both the original and duplicated blocks (in paralogous regions). The red line below the names identifying each block shows regions undergoing crossover. In the first column, the effect of crossover delimiting LD blocks is clear. When IGC is active (in the second and third column), a complex pattern of LD appears along the sequence together with the dark blue diagonal line representing LD between duplicate regions (stronger when no crossover is acting between paralogous windows of the duplicate blocks). With the presence of one hotspot on the original block, there are paralogous windows to the right of each duplicate between which there is no crossover and, thus, IGC has lower power to break LD in these fragments. In the case of two hotspots, this situation disappears and the combination of crossover and IGC breaks LD within duplicate blocks.

Similar articles

Cited by

References

    1. Andolfatto P., Nordborg M., 1998. The effect of gene conversion on intralocus associations. Genetics 148: 1397–1399 - PMC - PubMed
    1. Ardlie K., Liu-Cordero S. N., Eberle M. A., Daly M., Barrett J., et al. , 2001. Lower-than-expected linkage disequilibrium between tightly linked markers in humans suggests a role for gene conversion. Am. J. Hum. Genet. 69: 582–589 - PMC - PubMed
    1. Bailey J. A., Eichler E. E., 2006. Primate segmental duplications: crucibles of evolution, diversity and disease. Nat. Rev. Genet. 7: 552–564 - PubMed
    1. Bailey J. A., Gu Z., Clark R. A., Reinert K., Samonte R. V., et al. , 2002. Recent segmental duplications in the human genome. Science 297: 1003–1007 - PubMed
    1. Baltimore D., 1981. Gene conversion: some implications for immunoglobulin genes. Cell 24: 592–594 - PubMed

Publication types

LinkOut - more resources