Review
. 2014 Jul 9;114(13):6661-714.
doi: 10.1021/cr400695p. Epub 2014 Jun 5.

Physicochemical properties of cells and their effects on intrinsically disordered proteins (IDPs)

Affiliations
Review

Physicochemical properties of cells and their effects on intrinsically disordered proteins (IDPs)

Francois-Xavier Theillet et al. Chem Rev. .
No abstract available


Figures

Figure 1
Figure 1
Intracellular complexity. (A) Left: Cryo-electron tomography slice of a mammalian cell. Middle: Close-up view of cellular structures colored according to their identities: Right: Three-dimensional surface representation of the same region. Yellow, endoplasmic reticulum; orange, free ribosomes; green, mitochondria; blue, dense core vesicles; red, clathrin-positive compartments and vesicles; purple, clathrin-negative compartments and vesicles. Reprinted with permission from ref (27). Copyright 2012 Public Library of Science. (B) Tomography image of the interior of a Dictyostelium cell with actin filaments shown in orange and ribosomes in blue. Reprinted with permission from ref (29). Copyright 2012 Rockefeller University Press. (C) Schematic representation of the E. coli cytosol. Ribosomes and tRNA are shown in pink, chaperones in green and red, disordered proteins in orange, and all other proteins in dark blue. Reprinted with permission from ref (28). Copyrigth 2011 Elsevier.
Figure 2
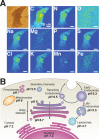
Figure 2
Intracellular composition. (A) Localization of various elements in a mammalian PC12 cell (exposed to MnCl2). Reprinted with permission from ref (44). Copyright 2009 Royal Society Publishing. (B) Average pH values of organelles and compartments in mammalian cells. Adapted with permission from ref (92). Copyright 2010 Nature Publishing Group.
Figure 3
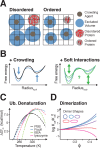
Figure 3
Excluded volume effects. (A) Schematic representation of excluded volume effects for disordered and folded proteins. (B) Left: IDP free energy as a function of compaction in noncrowded (black line) and crowded environments (blue line). Right: Representation of stabilizing or destabilizing effects via soft interactions (green lines). (C) Free energy of ubiquitin denaturation as a function of temperature in buffer pH 5.4 (black), 100 g/L Ficoll (blue), 100 g/L BSA (green), and 100 g/L lysozyme (pink). Solid lines are fits based on experimental measurements, dashed lines are extrapolations for different temperatures. Adapted with permission from ref (124). Copyright 2012 American Chemical Society. (D) Dimerization equilibrium constants for different dimer shapes (constant volumes) as a function of volume fraction ϕ of hard-sphere crowders. Adapted with permission from ref (123). Copyright 2008 Annual Reviews.
Figure 4
Figure 4
Macromolecular crowding and viscosity. (A) Schematic representation of water flows (black arrows) in response to protein movements (blue spheres and arrows). Forces resulting from water–protein friction are shown as red arrows. Translational diffusion is slowed down by hydrodynamic interactions with water flows caused by protein movements. (B) Different viscosity regimes experienced by probes of radii (rp) in the cytosol of E. coli and HeLa cells (red curves). Average size range of proteins is indicated in blue. Adapted with permission from references (157) and (170). Copyright 2011 American Chemical Society and Copyright 2012 Oxford University Press, respectively (C) Protein motions in crowded environments. Proteins experience Brownian motion in the depletion layer of apparent nanoviscosity (ηnano) (blue). The depletion layer moves according to the microviscosity (ηmicro) (gray) of its surrounding. (D) Particle mean square displacements (MSD) in different diffusion regimes as a function of time. Anomalous subdiffusion occurs at the transition between fast nano- (Dnano) and slow microdiffusion (Dmicro). Adapted with permission from ref (169). Copyright 2013 IOP Publishing.
Figure 5
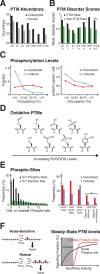
Figure 5
Post-translational modifications. (A) Experimental and predicted phospho-serines (pS), -threonines (pT), -tyrosines (pY), acetyl-lysines (acK), mono-, di-, or trimethyl-lysines (meK), symmetric and asymmetric dimethyl-arginines (meR), and O-glycosylated serines or threonines (O-Gly) according to ref (372). (B) Disorder scores for pS, pT, pY, acK, meK, and meR (black), and nonmodified residues (green), according to VSL2B, ref (382) and SwissProt, ref (380). Scores above or below 0.5 predict disorder or order, respectively. Scores for O-Gly (*) were calculated as the ratio of O-glycosylation sites in predicted IDRs over the total number of O-glycosylation sites in 190 proteins. For nonmodified sites, the ratio of serines/threonines in IDRs was determined over their numbers in the same set of proteins, ref (379). (C) Left: Fraction of pS/pT sites in disordered and ordered S. cerevisiae proteins and their relative phosphorylation levels (occupancy), according to ref (386). Right: Average number of proteins per S. cerevisiae cell and their relative phosphorylation levels, according to ref (394). (D) Chemical structures of post-translational amino acid modifications at increasing ROS/RNS levels. (E) Left: Distances between phosphorylated serine/threonine residues in eukaryotic proteins (black), versus average distances between random (modified and nonmodified) serine and threonine residues (green). Adapted with permission from ref (470). Copyright 2010 Biomed Central Ltd., Springer Science+Business media Right: Disorder and order at serine/threonine phosphorylation sites (pS/pT), at pS/pT sites with neighboring modification sites less than 4 residues apart (near pS/pT sites) and at pS/pT sites with no other modification site less than 4 residues away (other pS/pT sites). Adapted with permission from ref (470). Copyright 2010 Biomed Central Ltd., Springer Science+Business media. Average serine/threonine/tyrosine phosphorylation sites at oligomer interfaces and noninterface regions (**). Adapted with permission from ref (469). Copyright 2013 Royal Society of Chemistry. (F) Left: Sensitivity and robustness of single-, versus multiple-PTM signaling modes. Right: Switch-like responses result from multiple modifications in the presence of balanced kinase (Kin) and phosphatase (Phos) activities.
Figure 6
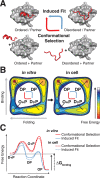
Figure 6
Coupled folding and binding. (A) Representations of induced fit and conformational selection mechanisms of coupled folding and binding reactions. The disordered and ordered ligand is shown in red (D and O, respectively), the folded binding partner (P) is shown in gray. (B) Schematic representations of possible differences between in vitro and in cell free energy landscapes of coupled folding and binding reactions. (C) Free energy/reaction coordinate profiles of coupled folding and binding systems and possible in vivo modulations. Resulting binding free energies (ΔGbinding) may be different.
Figure 7
Figure 7
Amyloid cascade. (A) Stages of amyloid formation. In the nucleation phase, IDP monomers aggregate via partially folded intermediates into soluble oligomers. During the exponential growth phase, oligomers assemble into high-molecular weight proto-fibrils, into which monomers are incorporated. In the stationary phase, proto-fibrils mature into amyloids. (B–D) Transmission electron microscopy (TEM) and (E–G) atomic force microscopy (AFM) images of Aβ aggregates. Structures of mature amyloid fibrils (B and E) and coexistence of linear (yellow) and annular (white) proto-fibrils (C). AFM of linear and annular proto-fibrils (F and G) and TEM of annular oligomers (D). Panels B-G adapted with permission from refs (−644). Panels B–D, Copyright 2003 Elsevier; Panel E, Copyright 2005 FASEB; Panel F, Copyright 2003 American Chemical Society and Panel G, Copyright 2005 US National Academy of Sciences.
Figure 8
Figure 8
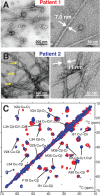
Amyloid polymorphisms. (A and B) TEM images of Aβ fibrils grown in vitro from pathological seeds of two Alzheimer’s disease patients. Yellow arrows point to fibrils with reduced diameters and periodic twists, not observed when grown from seeds of patient 1. (C) Superposition of two-dimensional, 13C–13C solid-state NMR spectra of patient 1 (red) and patient 2 fibrils (blue). Labels indicate cross-peak assignments for patient 2 fibrils. Reprinted with permission from ref (775). Copyright 2013 Elsevier.
Figure 9
Figure 9
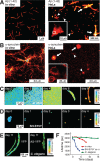
Intracellular morphology and aggregation kinetics of example IDPs. Super-resolution microscopy images of in vitro and in HeLa cell aggregates of Aβ peptides (A) and α-synuclein (B). Arrows and arrowheads denote fibrillar and small oligomeric species. Insets show intracellular peptide/protein localization. Aggregation kinetics of yellow-fluorescence protein (YFP)-coupled α-synuclein in vitro (C), in SH-SY5Y cells (D) and in C. elegans (E), as determined by single photon counting fluorescence lifetime microscopy. Shorter fluorescence lifetimes indicate more aggregated α-synuclein. (F) Time evolution of α-synuclein YFP fluorescence in the three systems. Reprinted with permissions from refs (782), (787), and (789). Panel A, Copyright 2011 American Chemical Society; panel B, Copyright 2012 Elsevier; panels C–E Copyright 2011 WILEY-VCH Verlag GmbH & Co.

Similar articles

Cited by

References

    1. Eliezer D. Curr. Opin. Struct. Biol. 2009, 19, 23. - PMC - PubMed
    1. Mittag T.; Forman-Kay J. D. Curr. Opin. Struct. Biol. 2007, 17, 3. - PubMed
    1. Schneider R.; Huang J. R.; Yao M.; Communie G.; Ozenne V.; Mollica L.; Salmon L.; Jensen M. R.; Blackledge M. Mol. Biosyst. 2012, 8, 58. - PubMed
    1. Uversky V. N. Biochim.Biophy. Acta 2013, 1834, 932. - PubMed
    1. Dunker A. K.; Obradovic Z.; Romero P.; Garner E. C.; Brown C. J. Genome Inform. Ser. Workshop Genome Inform. 2000, 11, 161. - PubMed

Publication types

Substances

LinkOut - more resources