

Effects of new mutations on fitness: insights from models and data
- PMID: 24891070
- PMCID: PMC4282485
- DOI: 10.1111/nyas.12460
Effects of new mutations on fitness: insights from models and data
Abstract
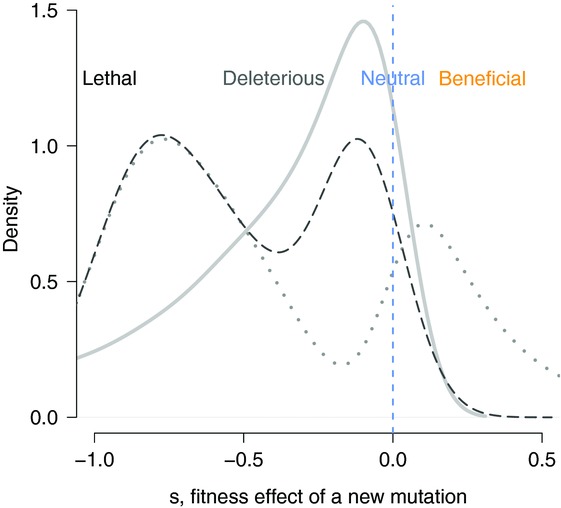
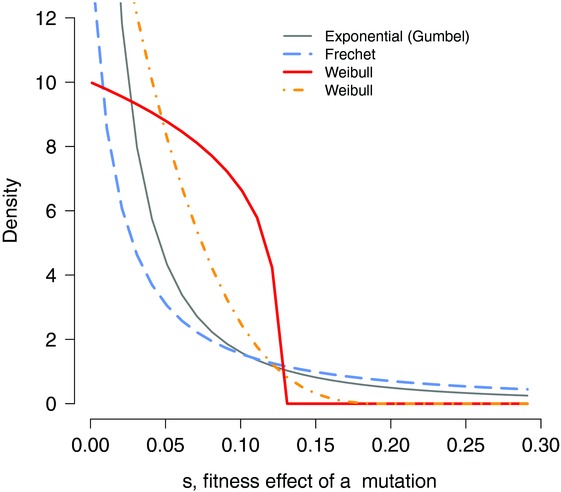
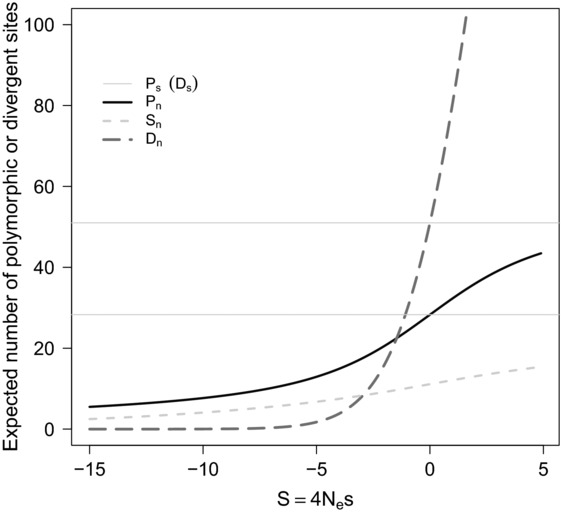
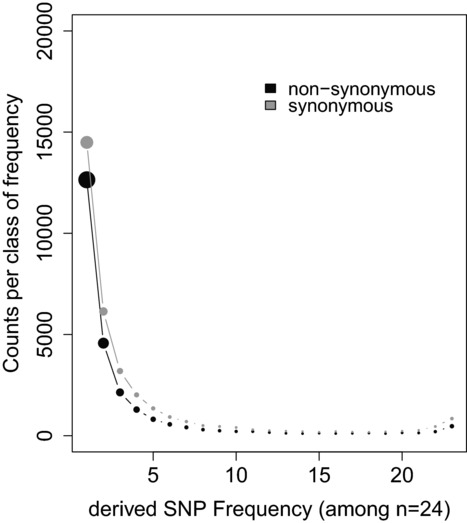
The rates and properties of new mutations affecting fitness have implications for a number of outstanding questions in evolutionary biology. Obtaining estimates of mutation rates and effects has historically been challenging, and little theory has been available for predicting the distribution of fitness effects (DFE); however, there have been recent advances on both fronts. Extreme-value theory predicts the DFE of beneficial mutations in well-adapted populations, while phenotypic fitness landscape models make predictions for the DFE of all mutations as a function of the initial level of adaptation and the strength of stabilizing selection on traits underlying fitness. Direct experimental evidence confirms predictions on the DFE of beneficial mutations and favors distributions that are roughly exponential but bounded on the right. A growing number of studies infer the DFE using genomic patterns of polymorphism and divergence, recovering a wide range of DFE. Future work should be aimed at identifying factors driving the observed variation in the DFE. We emphasize the need for further theory explicitly incorporating the effects of partial pleiotropy and heterogeneity in the environment on the expected DFE.
Keywords: distribution of fitness effects; experimental evolution; mutation; mutational landscape models; population genomics.
© 2014 The Authors. Annals of the New York Academy of Sciences published by Wiley Periodicals Inc. on behalf of The New York Academy of Sciences.
Figures
Similar articles
-
Inferring the distribution of fitness effects of spontaneous mutations in Chlamydomonas reinhardtii.PLoS Biol. 2019 Jun 26;17(6):e3000192. doi: 10.1371/journal.pbio.3000192. eCollection 2019 Jun. PLoS Biol. 2019. PMID: 31242179 Free PMC article.
-
A null model for the distribution of fitness effects of mutations.Proc Natl Acad Sci U S A. 2023 Jun 6;120(23):e2218200120. doi: 10.1073/pnas.2218200120. Epub 2023 May 30. Proc Natl Acad Sci U S A. 2023. PMID: 37252948 Free PMC article.
-
Determining the factors driving selective effects of new nonsynonymous mutations.Proc Natl Acad Sci U S A. 2017 Apr 25;114(17):4465-4470. doi: 10.1073/pnas.1619508114. Epub 2017 Apr 11. Proc Natl Acad Sci U S A. 2017. PMID: 28400513 Free PMC article.
-
What does the distribution of fitness effects of new mutations reflect? Insights from plants.New Phytol. 2022 Feb;233(4):1613-1619. doi: 10.1111/nph.17826. Epub 2021 Nov 16. New Phytol. 2022. PMID: 34704271 Review.
-
Fitness effects of beneficial mutations: the mutational landscape model in experimental evolution.Curr Opin Genet Dev. 2006 Dec;16(6):618-23. doi: 10.1016/j.gde.2006.10.006. Epub 2006 Oct 19. Curr Opin Genet Dev. 2006. PMID: 17055718 Review.
Cited by
-
Experimental Determination and Prediction of the Fitness Effects of Random Point Mutations in the Biosynthetic Enzyme HisA.Mol Biol Evol. 2018 Mar 1;35(3):704-718. doi: 10.1093/molbev/msx325. Mol Biol Evol. 2018. PMID: 29294020 Free PMC article.
-
Precise measurement of the fitness effects of spontaneous mutations by droplet digital PCR in Burkholderia cenocepacia.Genetics. 2021 Oct 2;219(2):iyab117. doi: 10.1093/genetics/iyab117. Genetics. 2021. PMID: 34849876 Free PMC article.
-
Between but Not Within-Species Variation in the Distribution of Fitness Effects.Mol Biol Evol. 2023 Nov 3;40(11):msad228. doi: 10.1093/molbev/msad228. Mol Biol Evol. 2023. PMID: 37832225 Free PMC article.
-
The road not taken: Could stress-specific mutations lead to different evolutionary paths?PLoS Biol. 2017 Jun 8;15(6):e2002862. doi: 10.1371/journal.pbio.2002862. eCollection 2017 Jun. PLoS Biol. 2017. PMID: 28594832 Free PMC article. Review.
-
Viruses in astrobiology.Front Microbiol. 2022 Oct 26;13:1032918. doi: 10.3389/fmicb.2022.1032918. eCollection 2022. Front Microbiol. 2022. PMID: 36386652 Free PMC article. Review.
References
-
- Chevin L-M, Martin G. Lenormand T. Fisher's model and the genomics of adaptation: restricted pleiotropy, heterogeneous mutation, and parallel evolution. Evolution. 2010;64:3213–3231. - PubMed
-
- Hoffmann AA. Sgrò CM. Climate change and evolutionary adaptation. Nature. 2011;470:479–485. - PubMed
-
- Otto SP. Lenormand T. Resolving the paradox of sex and recombination. Nat. Rev. Genet. 2002;3:252–261. - PubMed
Publication types
MeSH terms
LinkOut - more resources
Full Text Sources
Other Literature Sources
