. 2014 May 21:5:3864.
doi: 10.1038/ncomms4864.

Pathogenic potential of interferon αβ in acute influenza infection

Affiliations
Free PMC article

Pathogenic potential of interferon αβ in acute influenza infection

Sophia Davidson et al. Nat Commun. .
Free PMC article

Abstract

Influenza symptoms vary from mild disease to death; however, determinants of severity are unclear. Type I interferons (IFNαβ) are recognized as key antiviral cytokines. Here we show that, surprisingly, influenza-infected 129 mice have increased lung damage, morbidity and mortality, yet higher levels of IFNαβ, than C57BL/6 mice. Consistently, IFNα treatment of influenza-infected C57BL/6 mice increases morbidity. IFNαβ receptor deficiency in 129 mice decreases morbidity, lung damage, proinflammatory cytokines and lung-infiltrating inflammatory cells, and reduces expression of the death-inducing receptor DR5 on lung epithelia and its ligand TRAIL on inflammatory monocytes. Depletion of PDCA-1+ cells or interruption of TRAIL-DR5 interaction protects infected 129 mice. Selective lack of IFNαβ signalling in stromal cells abolishes epithelial DR5 upregulation and apoptosis, reducing host susceptibility. Hence, excessive IFNαβ signalling in response to acute influenza infection can result in uncontrolled inflammation and TRAIL-DR5-mediated epithelial cell death, which may explain morbidity and has important implications for treatment of severe disease.


Figures
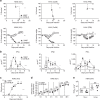
Figure 1
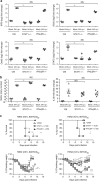
Figure 1. Increased influenza susceptibility of 129S7 mice correlates with higher concentrations of type I and type III interferons.
(a) 129S7 (filled triangles) or B6 (open circles) mice were infected i.n. by indicated influenza virus strains: X31 (800 TCID50), Cal09 (1,000 TCID50) or PR8 (5 TCID50), and weight loss and mortality recorded. (bd) 129S7 and B6 mice were infected with X31(800 TCID50). (b) IFN levels in BAL fluid were measured by ELISA, and (c) mice were scored for clinical symptoms (as described in methods). (d,e) Viral presence in infected lungs was quantitated (d) by qPCR for the X31 Matrix gene in RNA from whole lungs or (e) by virus titration. Graphs show mean±s.e.m. and are representative of 2–5 independent experiments where n=3 for ELISA data, n=4 for qPCR and virus titration and n≥6 for weight loss and mortality. ***P<0.0001, **P<0.001, *P<0.01 by two-way ANOVA with Bonferroni post-tests (weight loss and ELISA) where symbols on the right of graphs indicate statistical significance of the whole curve, as tested by two-way ANOVA, and those above specific days indicate significance found by post test, Log-rank (Mantel-Cox) Test (survival) or Mann–Whitney test (viral quantification).
Figure 2
Figure 2. Increased susceptibility of 129 mice is independent of adaptive immunity.
(ac) Rag-deficient 129 (filled triangles) or B6 (open circles) mice were infected intranasally with 800 TCID50 of X31, and (a) weight loss and morbidity recorded. (b) Virus RNA present in the lung on day 9 was determined by RT–PCR on total lung, and (c) IFN protein was quantified by ELISA in BAL fluid. Graphs show mean±s.e.m. and are representative of two independent experiments where n=5–6 for weight loss and survival and n=3–5 for ELISA and qPCR. ***P<0.0001, **P<0.001, *P<0.01 by two-way ANOVA with Bonferroni post tests (weight loss and ELISA) or Log-rank (Mantel-Cox) Test (survival) or Mann–Whitney test (viral quantification). The symbols on the right of graphs indicate statistical significance of the whole curve, as tested by two-way ANOVA.
Figure 3
Figure 3. Lack of type I IFN signalling is protective in 129S7 mice.
(ac) 129 (open triangles) or IFNαβR−/− (filled triangles) mice were infected i.n. with X31, 800 TCID50 or Cal09, 330 TCID50. (a) Weight loss and mortality were measured. (b) Haematoxylin & Eosin-stained sections (scale bar 50 μm) from lungs taken at days 0 and 8 post infection. Arrows indicate leukocyte infiltrate and arrowheads indicate intact alveolar structure. (c) Virus titres in lung homogenates taken at the indicated time points were measured by TCID50 determination on MDCK cells. (d) B6 mice were infected i.n. with X31 (8000 TCID50 in 30 μl) or treated with vehicle control on d0 and subsequently treated with mammalian IFNα4 (3.5 × 10⁴IU  per 200 μl i.p.), or vehicle control every 24 h from d1 to d6. Weight loss and morbidity were recorded over time. Graphs show mean±s.e.m. and are representative of 2–4 independent experiments where n=5–6 for weight loss and survival and n=4 for viral titration. X31+IFNα4:X31+Vehicle Control *, X31+IFNα4:Vehicle Control+IFNα4 . *** or ○○○P<0.0001, ** or ○○P<0.001, * or P<0.01 by two-way ANOVA with Bonferroni post-tests (weight loss) or Mann–Whitney test (viral quantification) or Log-rank (Mantel–Cox) Test (survival). The symbols on the right of graphs indicate statistical significance of the whole curve, as tested by two-way ANOVA.
Figure 4
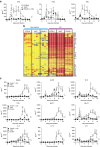
Figure 4. STAT1 is required for ISG induction and resistance on influenza infection of 129 mice.
(a,b) STAT1−/−(129), IFNαβR−/−(129) and 129 epithelial cell cultures were infected with X31 at a MOI of 1. At 24 h post infection upregulation of (a) Oasl2, STAT2, IRF9, Ifi203, (b) IL-28 (IFNλ) mRNA and replication of X31 was assessed by RT–PCR. (c) STAT1−/−(129) (crossed circles), IFNαβR−/−(129) (filled triangles) and 129 mice (open triangles) were infected i.n. with 800 TCID50 (upper panels) or 80 TCID50 (lower panels) of X31. Weight loss and survival were recorded throughout infection. Graphs show mean±s.e.m. and are representative of two independent experiments where n=5 for qPCR and n=6 for weight loss and survival. 129:STAT1−/−(129) * and IFNαβR−/−(129):STAT1−/−(129) , where **** or P<0.00001, ** or P<0.001, *P<0.01 by 2-way ANOVA (weight loss), Log-rank (Mantel-Cox) Test (survival) or Mann–Whitney test (RT–PCR quantification). The symbols on the right of graphs indicate statistical significance of the whole curve, as tested by two-way ANOVA.
Figure 5
Figure 5. Type I IFN signalling in 129S7 mice leads to high concentrations of proinflammatory cytokines in BAL.
(ac) 129S7 (open triangles), IFNαβR−/−(129) (filled triangles) or B6 (open circles) mice were infected i.n. with 800 TCID50 of X31. (a) IFN levels in BAL fluid were measured by ELISA and (c) specified pro-inflammatory cytokine concentrations were quantified by Multiplex. (b) Heatmap displaying selected significantly regulated antiviral response genes. Total RNA from mock and X31-infected lung was analysed using Affymetrix Mouse Genome 430 2.0 microarrays at 5 days post infection. Supervised analysis was performed using statistical filtering (≥fourfold change relative to mock-infected C57BL/6; 2-way ANOVA, P<0.01, Benjamini-Hochberg multiple test correction). Graphs show mean±s.e.m. and are representative of two independent experiments where n=3–4. 129:IFNαβR−/−(129) * and 129:B6 , where *** or P<0.0001, ** or P<0.001, *P<0.01 by two-way ANOVA with Bonferroni post tests. The symbols on the right of graphs indicate statistical significance of the whole curve, as tested by two-way ANOVA.
Figure 6
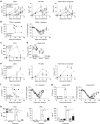
Figure 6. IFNαβ derived from pDCs and other PDCA-1+ cells mediates inflammation and morbidity in infected 129S7 mice.
(a) 129S7 (open triangles), IFNαβR−/−(129) (filled triangles) or B6 (open circles) mice were infected with X31 and flow cytometric quantification of pDCs, NK cells and inflammatory monocytes in the lung was performed. 129S7:IFNαβR−/−(129) *, 129S7:B6 . (be) 129S7 mice were treated with depleting mAb αPDCA-1 or isotype control as indicated, (b) weight loss and mortality were measured, (c) IFNα protein in BAL fluid was quantified by ELISA, (d) viral titre in BAL fluid were determined and (e) cell recruitment was assessed as in a. (f) 129S7 mice were treated with depleting mAbs RB6-8C5 (filled triangles), 1A8 (open diamonds) or isotype control (open triangles) then infected with X31. (g) 129S7 mice were treated with αAsialo GM1 (filled triangles) or Vehicle Control (open triangles) then infected with X31. (f,g) Mortality and weight loss were recorded. (h) BM-derived pDCs from 129 (open columns), IFNαβR−/−(129) (checked columns) and B6 (filled columns) mice were stimulated in vitro with X31. At 24 h supernatants were collected and concentrations of IFNα, β and λ were measured by ELISA. Graphs show mean±s.e.m. and are representative of 2–3 independent experiments where n=2–4 for cellular recruitment, virus titration and ELISA, n=5–6 for weight loss and survival except for b where data are pooled from two experiments (n=12). *** or P<0.0001, ** or P<0.001, *P<0.01 by two-way ANOVA with Bonferroni post tests (cell counts, weight loss and ELISA time course), Log-rank (Mantel-Cox) Test (survival) or Mann-Whitney test (pDC supernatants). The symbols on the right of graphs indicate statistical significance of the whole curve, as tested by two-way ANOVA.
Figure 7
Figure 7. PDCA-1+ cell depletion reduces secretion of proinflammatory cytokines in infected 129S7 mice.
(a,b) 129S7 mice were treated with αPDCA-1 (filled triangles) or isotype control (open triangles) and infected with X31. Cytokine concentrations in BAL fluid were measured (a) by ELISA for IFNβ and λ and (b) by Multiplex for indicated cytokines. Graphs show mean±s.e.m. where n=2–3 and ***P<0.0001, **P<0.001, *P<0.01 by two-way ANOVA with Bonferroni post tests. The symbols on the right of graphs indicate statistical significance of the whole curve, as tested by two-way ANOVA.
Figure 8
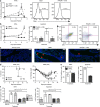
Figure 8. IFNαβ is upstream of TRAIL:DR5-mediated pathology in infected 129S7 mice.
(a,b) 129S7 (open triangles) or IFNαβR−/−(129) (filled triangles) mice were infected intranasally with X31, and lung single-cell suspensions were prepared at the indicated time points after infection. At specified time points, flow cytrometric analysis was performed to assess expression of (a) TRAIL on inflammatory monocytes (which were gated as shown in Supplementary Fig. 6). Histograms show TRAIL expression on d6. (b) Flow cytrometric analysis of DR5 expression on epithelial cells (E cadherin+, CD45−) over time. At 7 d.p.i. epithelial cells were assessed for free amine staining as a measure of apoptosis. Dot plots show the correlation between free amine and DR5 stain on d7. (c) Lung sections from control and infected mice with the indicated genotypes were stained by TUNEL for apoptotic cells. Red arrowheads indicate TUNEL signal. Scale bar, 100 μm. (d,e) 129S7 mice were treated with the TRAIL-blocking mAb αCD253 (150 μg  per 200 μl i.p.) or with isotype control as indicated, mortality and morbidity were recorded throughout infection and (e) at 7 d.p.i. epithelial cells were assessed for DR5 expression and apoptosis. (f) BM chimeras were generated: 129S7>129S7 (wt>wt, open bars), IFNaβR−/−(129)>129S7 (KO>wt, grey bars), 129S7>IFNaβR−/−(129) (wt>KO, grey checked bars) and IFNaβR−/−(129)>IFNaβR−/−(129) (KO>KO, checked bars) and infected with X31, and expression of DR5 on epithelial cells and epithelial cell apoptosis was assessed at 7 d.p.i. Graphs show mean±s.e.m. and are representative of 2–3 independent experiments where n=3 for FACS data and n=6 for weight loss and survival. ***P<0.0001, **P<0.001, *P<0.01 by two-way ANOVA with Bonferroni post tests (TRAIL and DR5 expression and weight loss), Log-rank (Mantel–Cox) Test (survival) or Mann–Whitney test (DR5 expression and apoptosis) where * denotes wt>wt:KO>KO, +stands for KO>KO:wt>KO and represents KO>KO:KO>wt. The symbols on the right of graphs indicate statistical significance of the whole curve, as tested by two-way ANOVA.

Similar articles

Cited by

References

    1. Peiris J. S., Cheung C. Y., Leung C. Y. & Nicholls J. M. Innate immune responses to influenza A H5N1: friend or foe? Trends. Immunol. 30, 574–584 (2009). - PMC - PubMed
    1. Wang T. T., Parides M. K. & Palese P. Seroevidence for H5N1 influenza infections in humans: meta-analysis. Science 335, 1463 (2012). - PMC - PubMed
    1. Everitt A. R. et al. IFITM3 restricts the morbidity and mortality associated with influenza. Nature 484, 519–523 (2012). - PMC - PubMed
    1. Horby P., Nguyen N. Y., Dunstan S. J. & Baillie J. K. The role of host genetics in susceptibility to influenza: a systematic review. PLoS ONE 7, e33180 (2012). - PMC - PubMed
    1. Albright F. S., Orlando P., Pavia A. T., Jackson G. G. & Cannon Albright L. A. Evidence for a heritable predisposition to death due to influenza. J. Infect. Dis. 197, 18–24 (2008). - PubMed

Publication types

MeSH terms

Substances

Associated data