Aerosol Mycobacterium tuberculosis infection causes rapid loss of diversity in gut microbiota
- PMID: 24819223
- PMCID: PMC4018338
- DOI: 10.1371/journal.pone.0097048
Aerosol Mycobacterium tuberculosis infection causes rapid loss of diversity in gut microbiota
Abstract
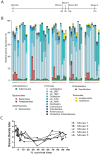
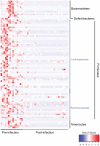
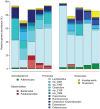
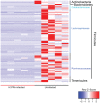
Mycobacterium tuberculosis is an important human pathogen, and yet diagnosis remains challenging. Little research has focused on the impact of M. tuberculosis on the gut microbiota, despite the significant immunological and homeostatic functions of the gastrointestinal tract. To determine the effect of M. tuberculosis infection on the gut microbiota, we followed mice from M. tuberculosis aerosol infection until death, using 16S rRNA sequencing. We saw a rapid change in the gut microbiota in response to infection, with all mice showing a loss and then recovery of microbial community diversity, and found that pre-infection samples clustered separately from post-infection samples, using ecological beta-diversity measures. The effect on the fecal microbiota was observed as rapidly as six days following lung infection. Analysis of additional mice infected by a different M. tuberculosis strain corroborated these results, together demonstrating that the mouse gut microbiota significantly changes with M. tuberculosis infection.
Conflict of interest statement
Figures


Similar articles
-
Profiling the airway in the macaque model of tuberculosis reveals variable microbial dysbiosis and alteration of community structure.Microbiome. 2018 Oct 9;6(1):180. doi: 10.1186/s40168-018-0560-y. Microbiome. 2018. PMID: 30301469 Free PMC article.
-
Correlation between Disease Severity and the Intestinal Microbiome in Mycobacterium tuberculosis-Infected Rhesus Macaques.mBio. 2019 Jun 4;10(3):e01018-19. doi: 10.1128/mBio.01018-19. mBio. 2019. PMID: 31164469 Free PMC article.
-
Capturing the diversity of the human gut microbiota through culture-enriched molecular profiling.Genome Med. 2016 Jul 1;8(1):72. doi: 10.1186/s13073-016-0327-7. Genome Med. 2016. PMID: 27363992 Free PMC article.
-
Metagenomic surveys of gut microbiota.Genomics Proteomics Bioinformatics. 2015 Jun;13(3):148-58. doi: 10.1016/j.gpb.2015.02.005. Epub 2015 Jul 13. Genomics Proteomics Bioinformatics. 2015. PMID: 26184859 Free PMC article. Review.
-
Mycobacterium tuberculosis, antimicrobials, immunity, and lung-gut microbiota crosstalk: current updates and emerging advances.Ann N Y Acad Sci. 2020 May;1467(1):21-47. doi: 10.1111/nyas.14300. Epub 2020 Jan 28. Ann N Y Acad Sci. 2020. PMID: 31989644 Review.
Cited by
-
Predominance of Escherichia-Shigella in Gut Microbiome and Its Potential Correlation with Elevated Level of Plasma Tumor Necrosis Factor Alpha in Patients with Tuberculous Meningitis.Microbiol Spectr. 2022 Dec 21;10(6):e0192622. doi: 10.1128/spectrum.01926-22. Epub 2022 Nov 9. Microbiol Spectr. 2022. PMID: 36350161 Free PMC article.
-
Alterations in the intestinal microbiota associated with active tuberculosis and latent tuberculosis infection.Heliyon. 2023 Nov 11;9(11):e22124. doi: 10.1016/j.heliyon.2023.e22124. eCollection 2023 Nov. Heliyon. 2023. PMID: 38045157 Free PMC article.
-
Profiling the airway in the macaque model of tuberculosis reveals variable microbial dysbiosis and alteration of community structure.Microbiome. 2018 Oct 9;6(1):180. doi: 10.1186/s40168-018-0560-y. Microbiome. 2018. PMID: 30301469 Free PMC article.
-
The emerging role of the microbiota in the ICU.Crit Care. 2018 Mar 20;22(1):78. doi: 10.1186/s13054-018-1999-8. Crit Care. 2018. PMID: 29559006 Free PMC article. Review.
-
Gut microbial dysbiosis occurring during pulmonary fungal infection in rats is linked to inflammation and depends on healthy microbiota composition.Microbiol Spectr. 2023 Aug 25;11(5):e0199023. doi: 10.1128/spectrum.01990-23. Online ahead of print. Microbiol Spectr. 2023. PMID: 37623316 Free PMC article.
References
-
- World Health Organization. (2012) Tuberculosis. Available: http://www.who.int/mediacentre/factsheets/fs104/en/. Accessed: 28 Feb 2013.
-
- Nuermberger E (2008) Using animal models to develop new treatments for tuberculosis. Semin Respir Crit Care Med 29: 542–551. - PubMed
Publication types
MeSH terms
Substances
Associated data
Grants and funding
LinkOut - more resources
Full Text Sources
Other Literature Sources

