Immune-related gene signatures predict the outcome of neoadjuvant chemotherapy
- PMID: 24790795
- PMCID: PMC4004621
- DOI: 10.4161/onci.27884
Immune-related gene signatures predict the outcome of neoadjuvant chemotherapy
Abstract
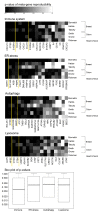
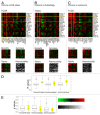
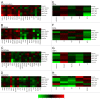
There is ample evidence that neoadjuvant chemotherapy of breast carcinoma is particularly efficient if the tumor presents signs of either a pre-existent or therapy-induced anticancer immune response. Antineoplastic chemotherapies are particularly beneficial if they succeed in inducing immunogenic cell death, hence converting the tumor into its own therapeutic vaccine. Immunogenic cell death is characterized by a pre-mortem stress response including endoplasmic reticulum stress and autophagy. Based on these premises, we attempted to identify metagenes that reflect an intratumoral immune response or local stress responses in the transcriptomes of breast cancer patients. No consistent correlations between immune- and stress-related metagenes could be identified across several cohorts of patients, representing a total of 1045 mammary carcinomas. Moreover, few if any, of the stress-relevant metagenes influenced the probability of pathological complete response to chemotherapy. In contrast, several immune-relevant metagenes had a significant positive impact on response rates. This applies in particular to a CXCL13-centered, highly reproducible metagene signature reflecting the intratumoral presence of interferon-γ-producing T cells.
Keywords: autophagy; breast cancer; colorectal cancer; endoplasmic stress; immunogenic cell death; tumor-infiltrating lymphocytes.
Figures


Similar articles
-
Dual roles for immune metagenes in breast cancer prognosis and therapy prediction.Genome Med. 2014 Oct 28;6(10):80. doi: 10.1186/s13073-014-0080-8. eCollection 2014. Genome Med. 2014. PMID: 25419236 Free PMC article.
-
Immunological metagene signatures derived from immunogenic cancer cell death associate with improved survival of patients with lung, breast or ovarian malignancies: A large-scale meta-analysis.Oncoimmunology. 2015 Aug 12;5(2):e1069938. doi: 10.1080/2162402X.2015.1069938. eCollection 2016 Feb. Oncoimmunology. 2015. PMID: 27057433 Free PMC article.
-
Meta-analysis of organ-specific differences in the structure of the immune infiltrate in major malignancies.Oncotarget. 2015 May 20;6(14):11894-909. doi: 10.18632/oncotarget.4180. Oncotarget. 2015. PMID: 26059437 Free PMC article.
-
Molecular pathways: involvement of immune pathways in the therapeutic response and outcome in breast cancer.Clin Cancer Res. 2013 Jan 1;19(1):28-33. doi: 10.1158/1078-0432.CCR-11-2701. Epub 2012 Dec 20. Clin Cancer Res. 2013. PMID: 23258741 Review.
-
Ki67 and lymphocytes in the pretherapeutic core biopsy of primary invasive breast cancer: positive markers of therapy response prediction and superior survival.Horm Mol Biol Clin Investig. 2017 Sep 22;32(2):/j/hmbci.2017.32.issue-2/hmbci-2017-0022/hmbci-2017-0022.xml. doi: 10.1515/hmbci-2017-0022. Horm Mol Biol Clin Investig. 2017. PMID: 28937963 Review.
Cited by
-
Identification of genetic determinants of breast cancer immune phenotypes by integrative genome-scale analysis.Oncoimmunology. 2017 Feb 6;6(2):e1253654. doi: 10.1080/2162402X.2016.1253654. eCollection 2017. Oncoimmunology. 2017. PMID: 28344865 Free PMC article.
-
Nanomedicine and Onco-Immunotherapy: From the Bench to Bedside to Biomarkers.Nanomaterials (Basel). 2020 Jun 29;10(7):1274. doi: 10.3390/nano10071274. Nanomaterials (Basel). 2020. PMID: 32610601 Free PMC article. Review.
-
Monitoring the responsiveness of T and antigen presenting cell compartments in breast cancer patients is useful to predict clinical tumor response to neoadjuvant chemotherapy.BMC Cancer. 2018 Jan 15;18(1):77. doi: 10.1186/s12885-017-3982-1. BMC Cancer. 2018. PMID: 29334915 Free PMC article.
-
Autocrine signaling of type 1 interferons in successful anticancer chemotherapy.Oncoimmunology. 2015 Jul 25;4(8):e988042. doi: 10.4161/2162402X.2014.988042. eCollection 2015 Aug. Oncoimmunology. 2015. PMID: 26405588 Free PMC article.
-
The immune contexture in cancer prognosis and treatment.Nat Rev Clin Oncol. 2017 Dec;14(12):717-734. doi: 10.1038/nrclinonc.2017.101. Epub 2017 Jul 25. Nat Rev Clin Oncol. 2017. PMID: 28741618 Review.
References
Publication types
LinkOut - more resources
Full Text Sources
Other Literature Sources
